
Domain model
Dependra models your organisation as one connected graph, four layers deep — from the quarterly goals at the top to the firewalls at the bottom. Nothing lives in isolation: every entity connects downward to what carries it and upward to what depends on it.
That computed layer is the payoff for connecting the graph — a failure entering at the bottom rolls up into business impact and surfaces on the objective it threatens, and a strategy question at the top drills down to the exact component responsible.
The Dependra Metamodel
The complete metamodel in one picture — every entity type and how the layers connect:
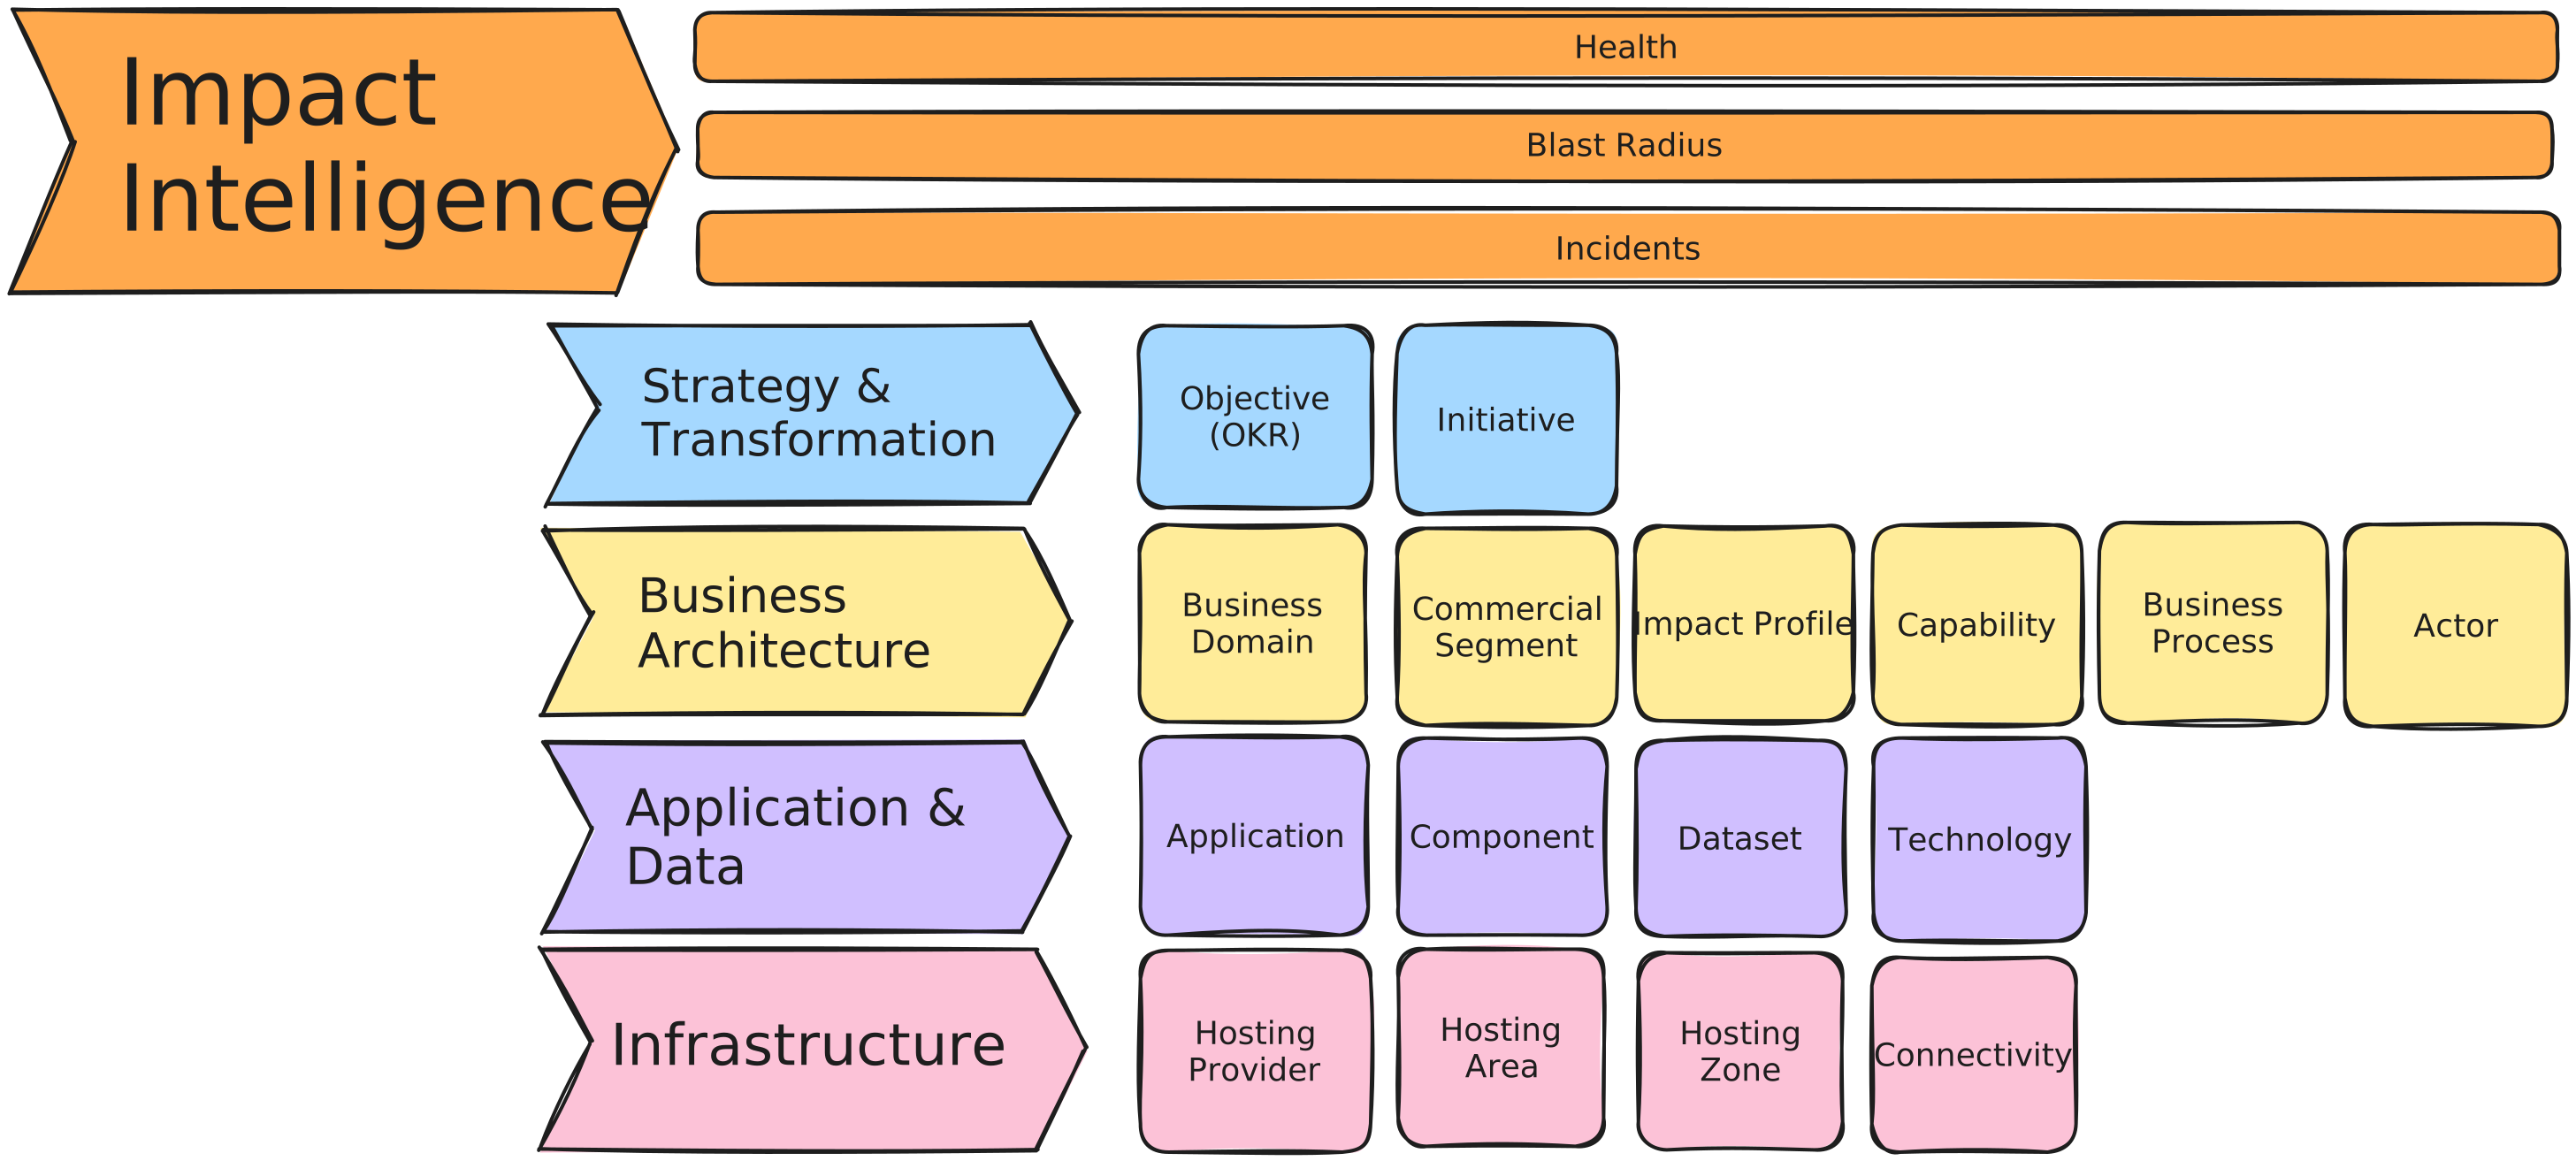
Strategy & Transformation
Layer 1 · Where you’re goingThe top of the graph: what the organisation is trying to achieve, and what it’s doing about it.
- Cycle — A time-bounded OKR period (quarterly, annual, or custom) owned by a team. Moves through Planning → Active → Scoring → Closed. On close, selected key results carry forward into the next cycle with a fresh baseline and a lineage link back to their predecessor.
- Objective — A qualitative goal — a direction, not a number. Belongs to a team, optionally sits in a cycle. Progress is the weighted average of its key results; there is no separate progress field to maintain by hand.
- Key Result — The measurable outcome. Start value, target value, and a drive mode: manual check-ins, one of 104 computed landscape metrics, a Jira JQL feed, or values pushed from your own tooling. Because key results link to initiatives — and initiatives scope real components — a degraded component can flag a key result At Risk automatically.
- Initiative — A project or programme with dates, CapEx/OpEx, and expected ROI. Linked to the specific key results it moves, and scoped to the applications and components it touches. The bridge between what we measure and what we’re doing about it.
Objectives can contribute to other objectives across teams and cycles, so a platform team’s quarterly goal ladders up into an organisation-level annual one. See Strategy & OKRs for the full model.
Strategy & OKRs is available on Enterprise and custom plans.
Business Architecture
Layer 2 · Who cares and how muchThe layer that turns an architecture graph into impact intelligence — the answer to “who cares, and what does it cost.”
- Capability — Something your organisation delivers (“Accept payments”). Carries a criticality tier and regulatory exposure, belongs to a business domain, and is delivered by applications and components. When those fail, the capability degrades — visibly.
- Business Domain — A grouping of related capabilities and datasets.
- Business Process — A versioned workflow of steps. Processes consume capabilities, so an outage doesn’t just mark a box red — it tells you which step of which process just stopped.
- Actor — A user group, role, or system that uses a capability, as a beneficiary or an operator. Carries an estimated user count, so impact reports answer “who is affected, and how many.”
- Segment — The commercial slices of your business: contracts, books of business, regional markets. If your revenue has line items, those are your segments. Most EA tools don’t have this concept, and it’s the reason they can only say “the capability is degraded.” The same capability usually serves several segments under different contracts with different revenue and different SLA terms — a transport operator’s “Transport passengers” capability serves a city bus contract and a regional rail contract; an insurer’s claims capability serves the broker channel, SME, and corporate books. Segments are what let an outage report say which contract is bleeding and whose SLA clock just started — not one blended number. (Not to be confused with Actors: Actors are who uses a capability; Segments are which commercial arrangement they use it under.)
- Impact Profile — The entity that puts a financial figure on an outage. Per-capability (and optionally per-segment) economics: annual revenue and cost, hourly impact, how hard the dependency bites, and the SLA grace period and penalty. All amounts are in your tenant’s currency — Dependra is currency-agnostic; examples in these docs use euros. This is where “the database is down” becomes “€45K/hour and the SLA clock started.”
- Dataset — A data asset with classification, legal basis, retention, and regulatory exposure. Datasets link to the components that master or consume them and to the dependency edges they flow across — the backbone of data lineage and the data-in-transit register.
Application & Data
Layer 3 · What things areWhat you build, buy, and run.
Product Suite
  └── Application
└── Component ──▶ Component (dependency edge)- Product Suite — A collection of related applications under shared ownership.
- Application — A distinct system with its own lifecycle. Carries lifecycle state, criticality tier, health, data classification, functional fit, owner team, RTO/RPO, annual cost, environment, tags, and custom properties.
- Component — A deployable unit within an application, with a kind (below) that determines its type-specific metadata. Components carry health, technical debt, data classification, network exposure and protection mechanisms, and can be marked external or a stub.
- Technology — What a component is made of: languages, frameworks, databases, runtimes. Technologies live on the tech radar (Adopt / Trial / Tolerate / Eliminate) and track end-of-life dates — so “what’s going obsolete underneath us” is a query, not a workshop.
- Dependencies — Directed edges between components (or between applications). The graph blast radius traverses. See Dependencies.
Component kinds
Each component has a kind. Values are case-sensitive and serialized exactly as shown:
| Kind | Examples |
|---|---|
WebAPI |
REST service, GraphQL endpoint |
WebApp |
Customer portal, admin dashboard |
Database |
PostgreSQL, MongoDB |
Queue |
SQS queue, job queue |
Cache |
Redis, Memcached |
EventBus |
Kafka, Solace, SNS / Service Bus broker |
Worker |
Background processor, consumer |
Storage |
S3 bucket, blob storage |
MobileApp |
iOS app, Android app |
DesktopApp |
Windows client, desktop tool |
ScheduledJob |
Nightly batch, cron job |
Integration |
ETL pipeline, iPaaS flow |
Identity |
Identity provider, auth service |
Infrastructure |
Firewall, gateway, load balancer |
Other |
Anything not covered above |
Each kind can carry type-specific metadata — for example, a WebAPI can record its URL and protocols.
Infrastructure
Layer 4 · Where things runWhere components actually run — because blast radius that ignores the network is a guess.
Hosting Provider
  ├── Hosting Area   (an account, subscription or site)
  └── Hosting Zone   (a region or availability zone)
└── Area × Zone ◀── a Component is deployed here- Hosting Provider — A cloud provider, data-centre operator, or on-premises site (AWS, Azure, your own DC).
- Hosting Area — A logical boundary within a provider (account, subscription, site).
- Hosting Zone — A deployment zone within a provider (region, availability zone). Zones are provider-level and shared; an area–zone link places an area’s workloads into a zone.
- Zone Connectivity — Directed network paths between area–zone pairings (internal, VPN, internet, direct-connect, peering, transit-gateway, private-link). When a zone or a link goes down, Dependra knows which components just lost their path — not just which ones live there.
Impact Intelligence — the computed layer
Output · Computed, never modelledYou never create a health record, a blast radius, or an incident by hand. They’re derived:
- Health — Signals from your monitoring (Datadog, Grafana, Zabbix, checkmk — whatever watches your estate) land on components and roll up through the graph.
- Blast Radius — For any component: everything downstream, the capabilities and processes affected, the actors hit, the revenue per hour exposed, and the SLA clocks started. Computed in seconds, across the full depth of the graph.
- Incidents — Health degradations cluster into incidents with per-segment SLA tracking, penalty exposure, and a full impact ledger — the outage isn’t over until you can explain what it cost.
Two worked examples
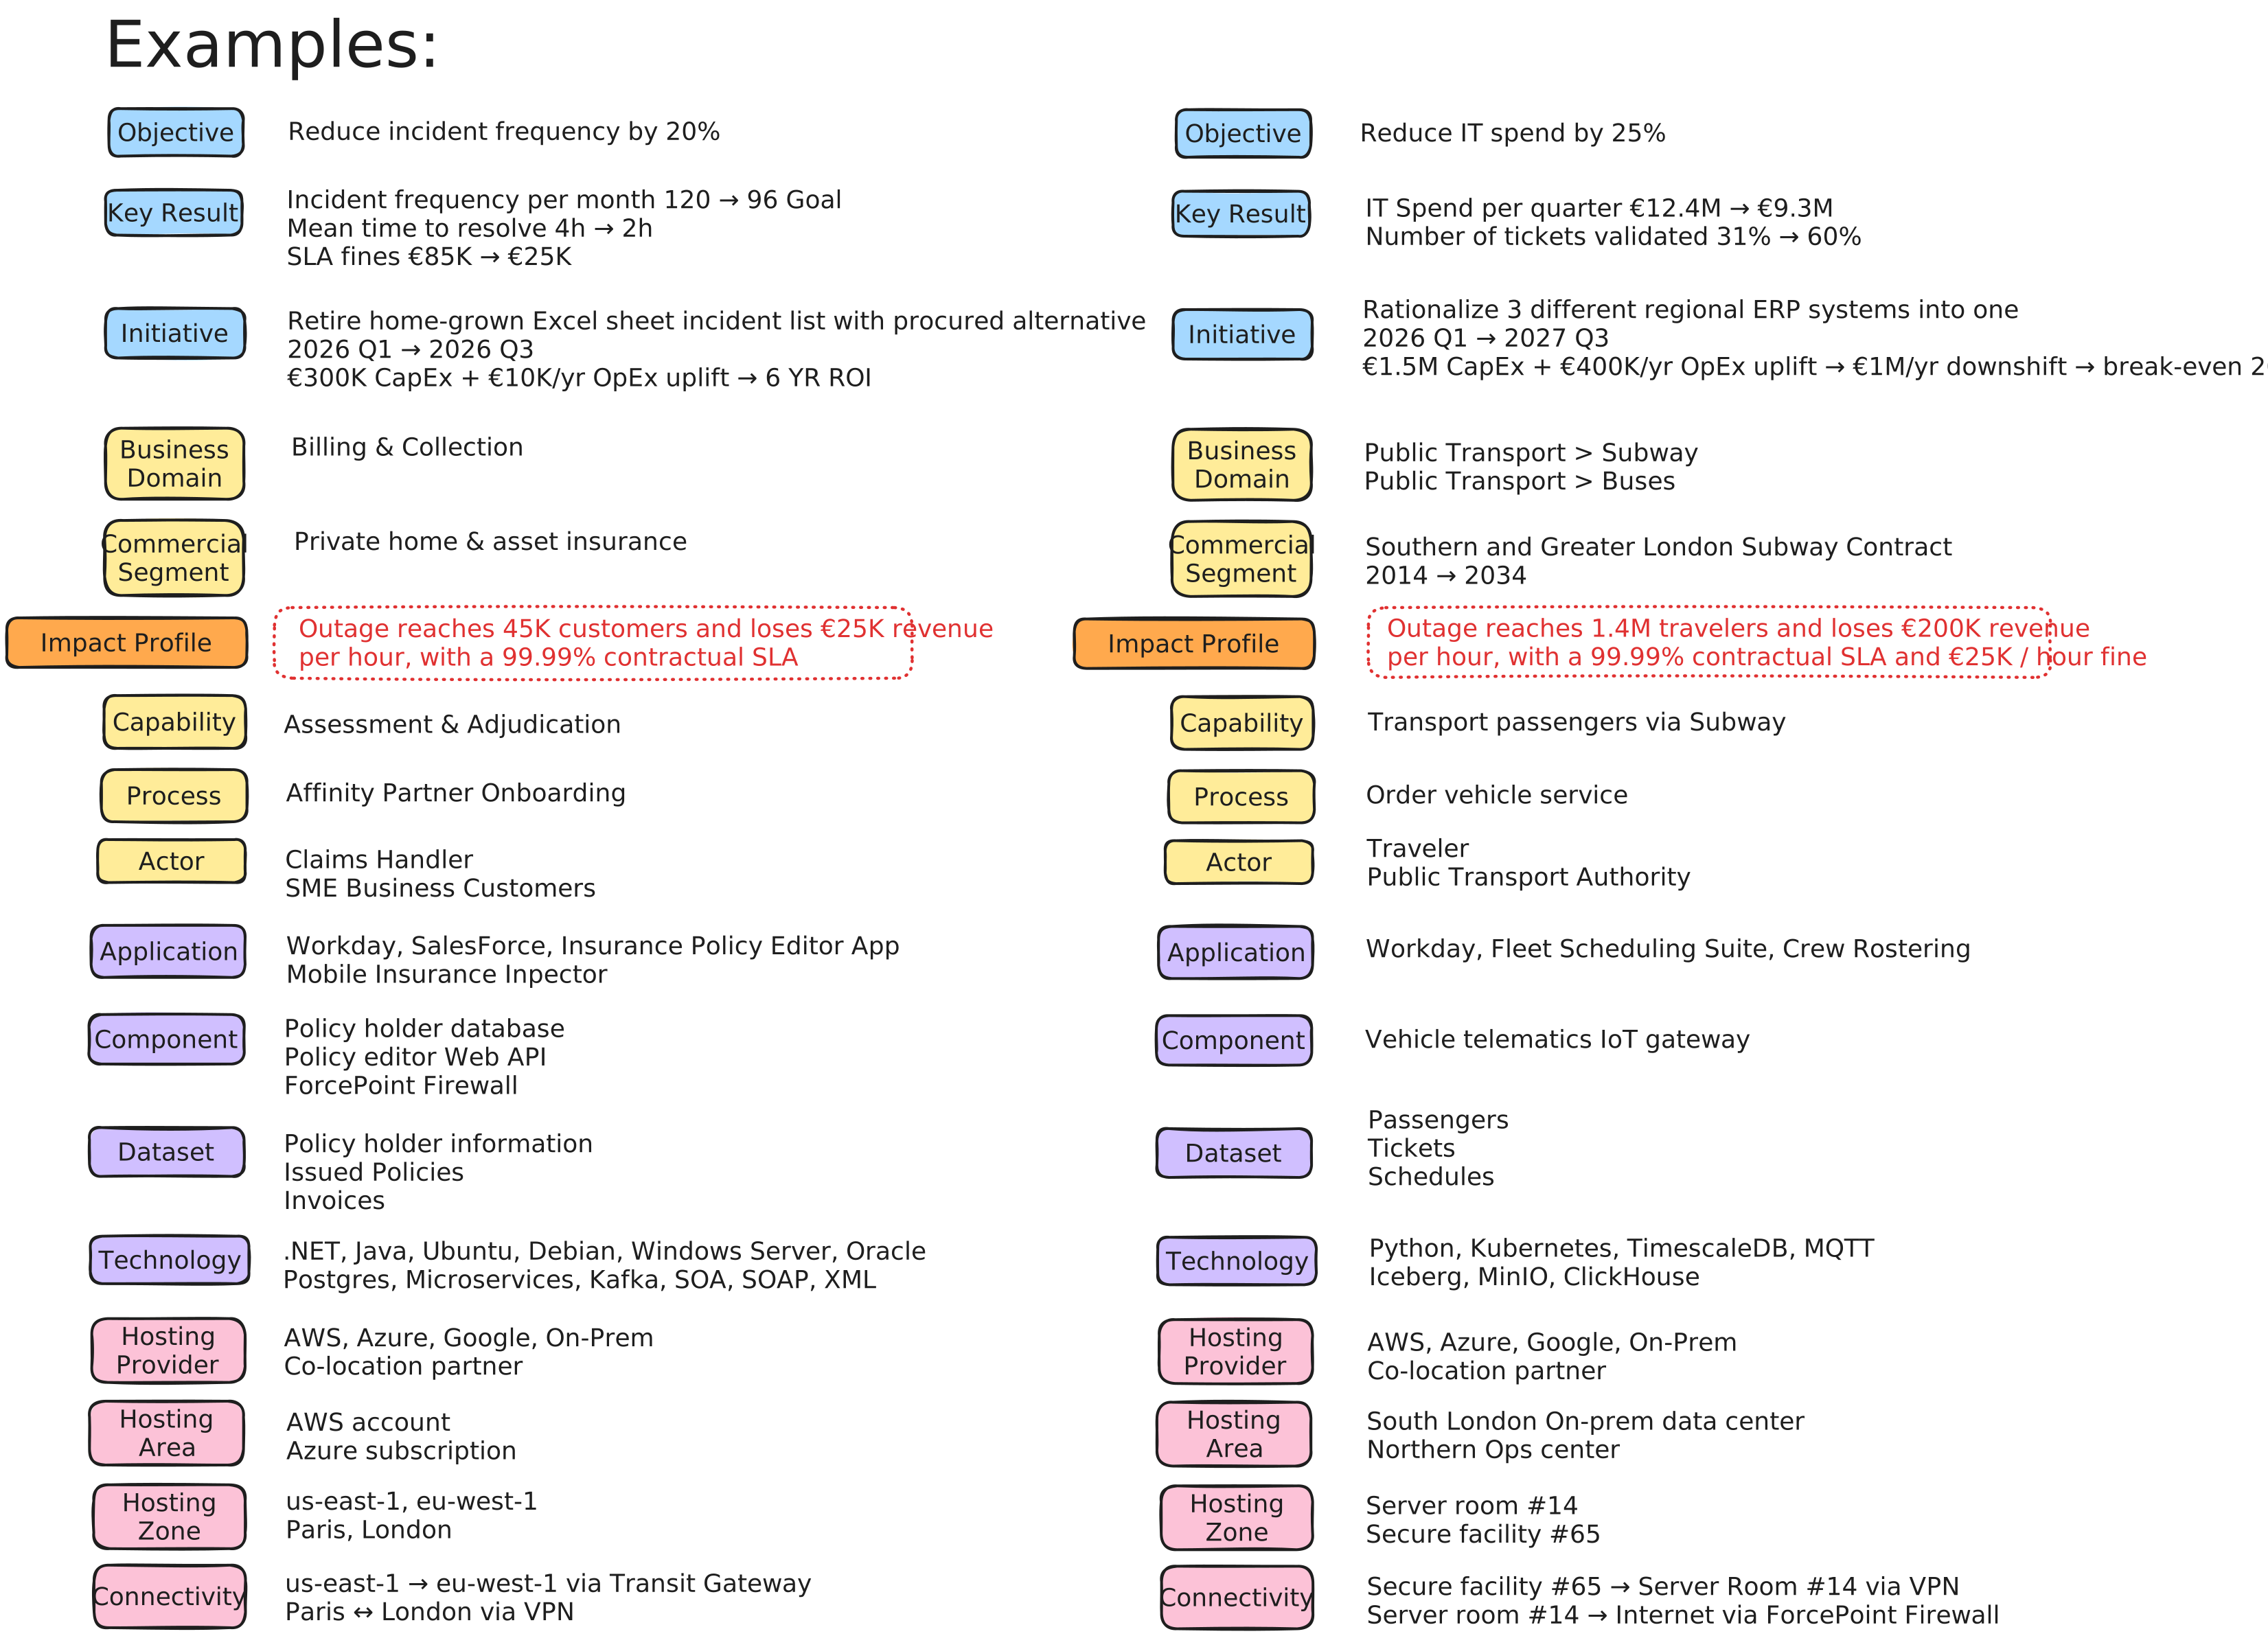
The drawing below maps the complete metamodel onto two realistic organisations — an insurance company whose objective is to cut incident frequency by 20%, and a public transport operator aiming to reduce IT spend by 25%. Every layer is filled in: the objective and its key results at the top, the initiatives funded to move them, the business domains, segments and impact profiles that put financial figures and SLA terms on an outage, and the applications, components, datasets and hosting underneath. The numbers are illustrative, but the shape is what a real Dependra landscape looks like.
Every entity supports a technicalName — a stable, human-readable identifier your scripts, manifests and API integrations reference instead of system-generated GUIDs.
Naming conventions
- Use clear, consistent names for product suites, applications and capabilities.
- Component names should reflect what the component does, not how it’s deployed.
- Use tags for cross-cutting labels (e.g.
pci,public-facing,legacy). - Document applications, components and capabilities with Markdown to keep knowledge current.