
Tie every IT decision to a number the board can read.
Dependra turns the “should we keep this?” debate into a defensible business case: IT cost allocated per capability, a cost trajectory on the roadmap, and a blast-radius engine that doubles as your ROI calculator.
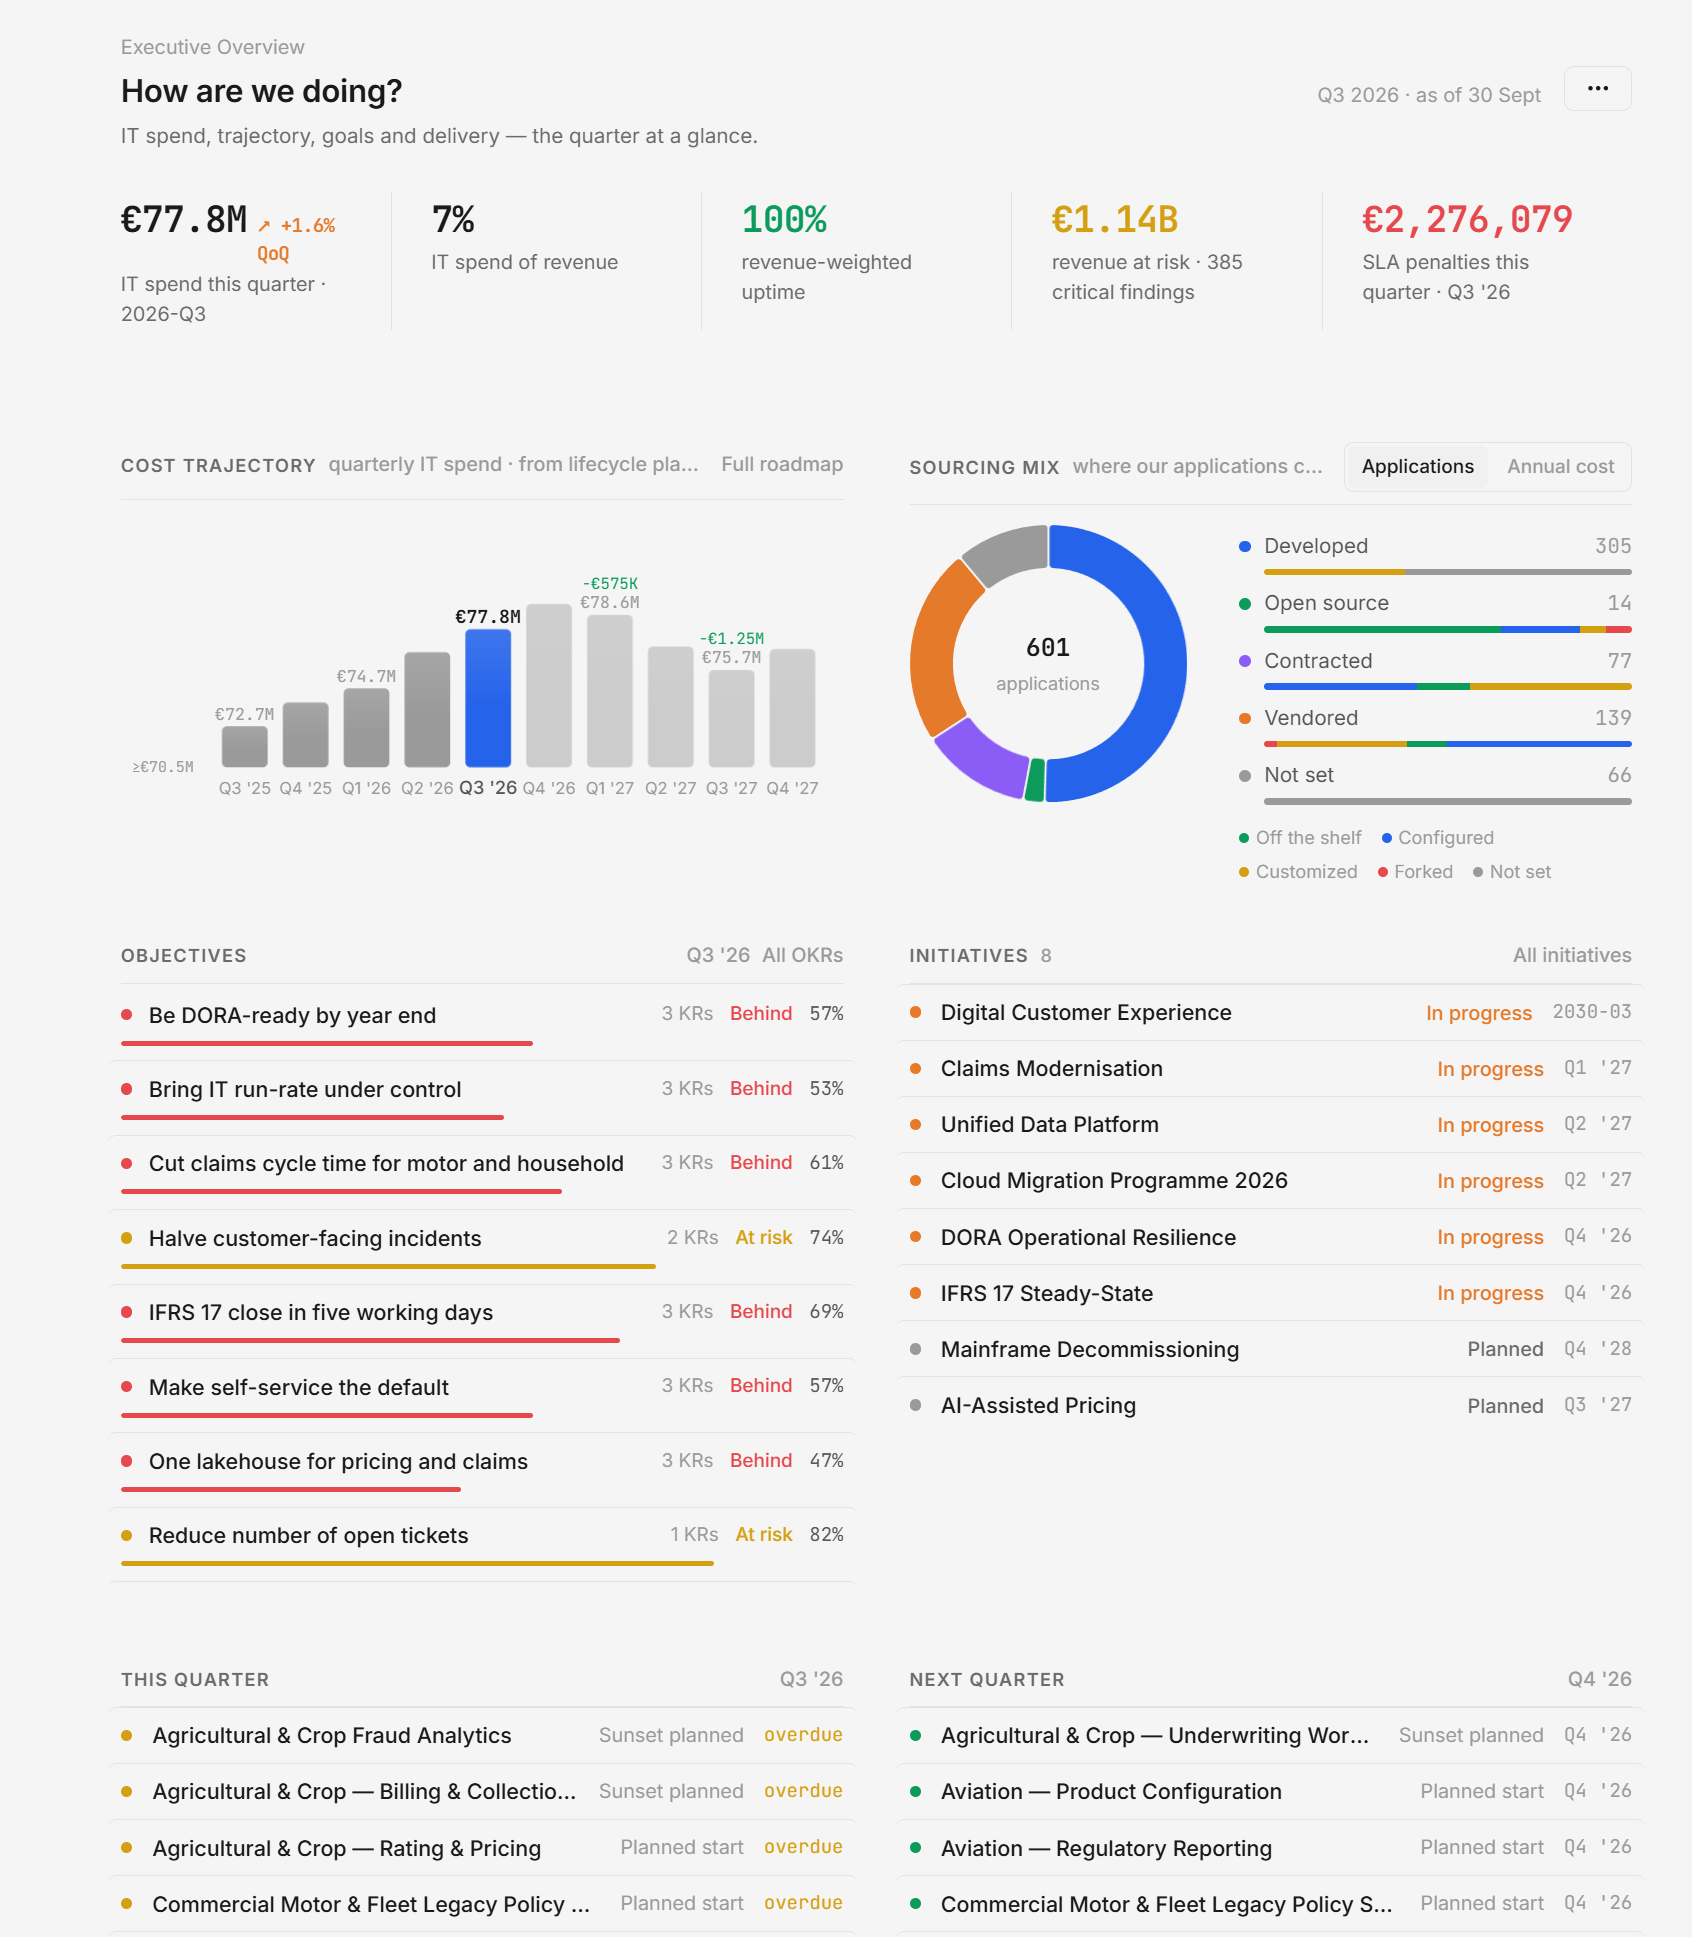
“We spend a fortune on IT I can't tie to business value, and the roadmap has no cost line.”
What does IT actually spend to run this business function?
Capability economics allocates IT cost across the applications and actors that deliver each capability, so investment decisions are made per business function rather than per system. This is IT cost-to-serve allocation — not general-ledger accounting.
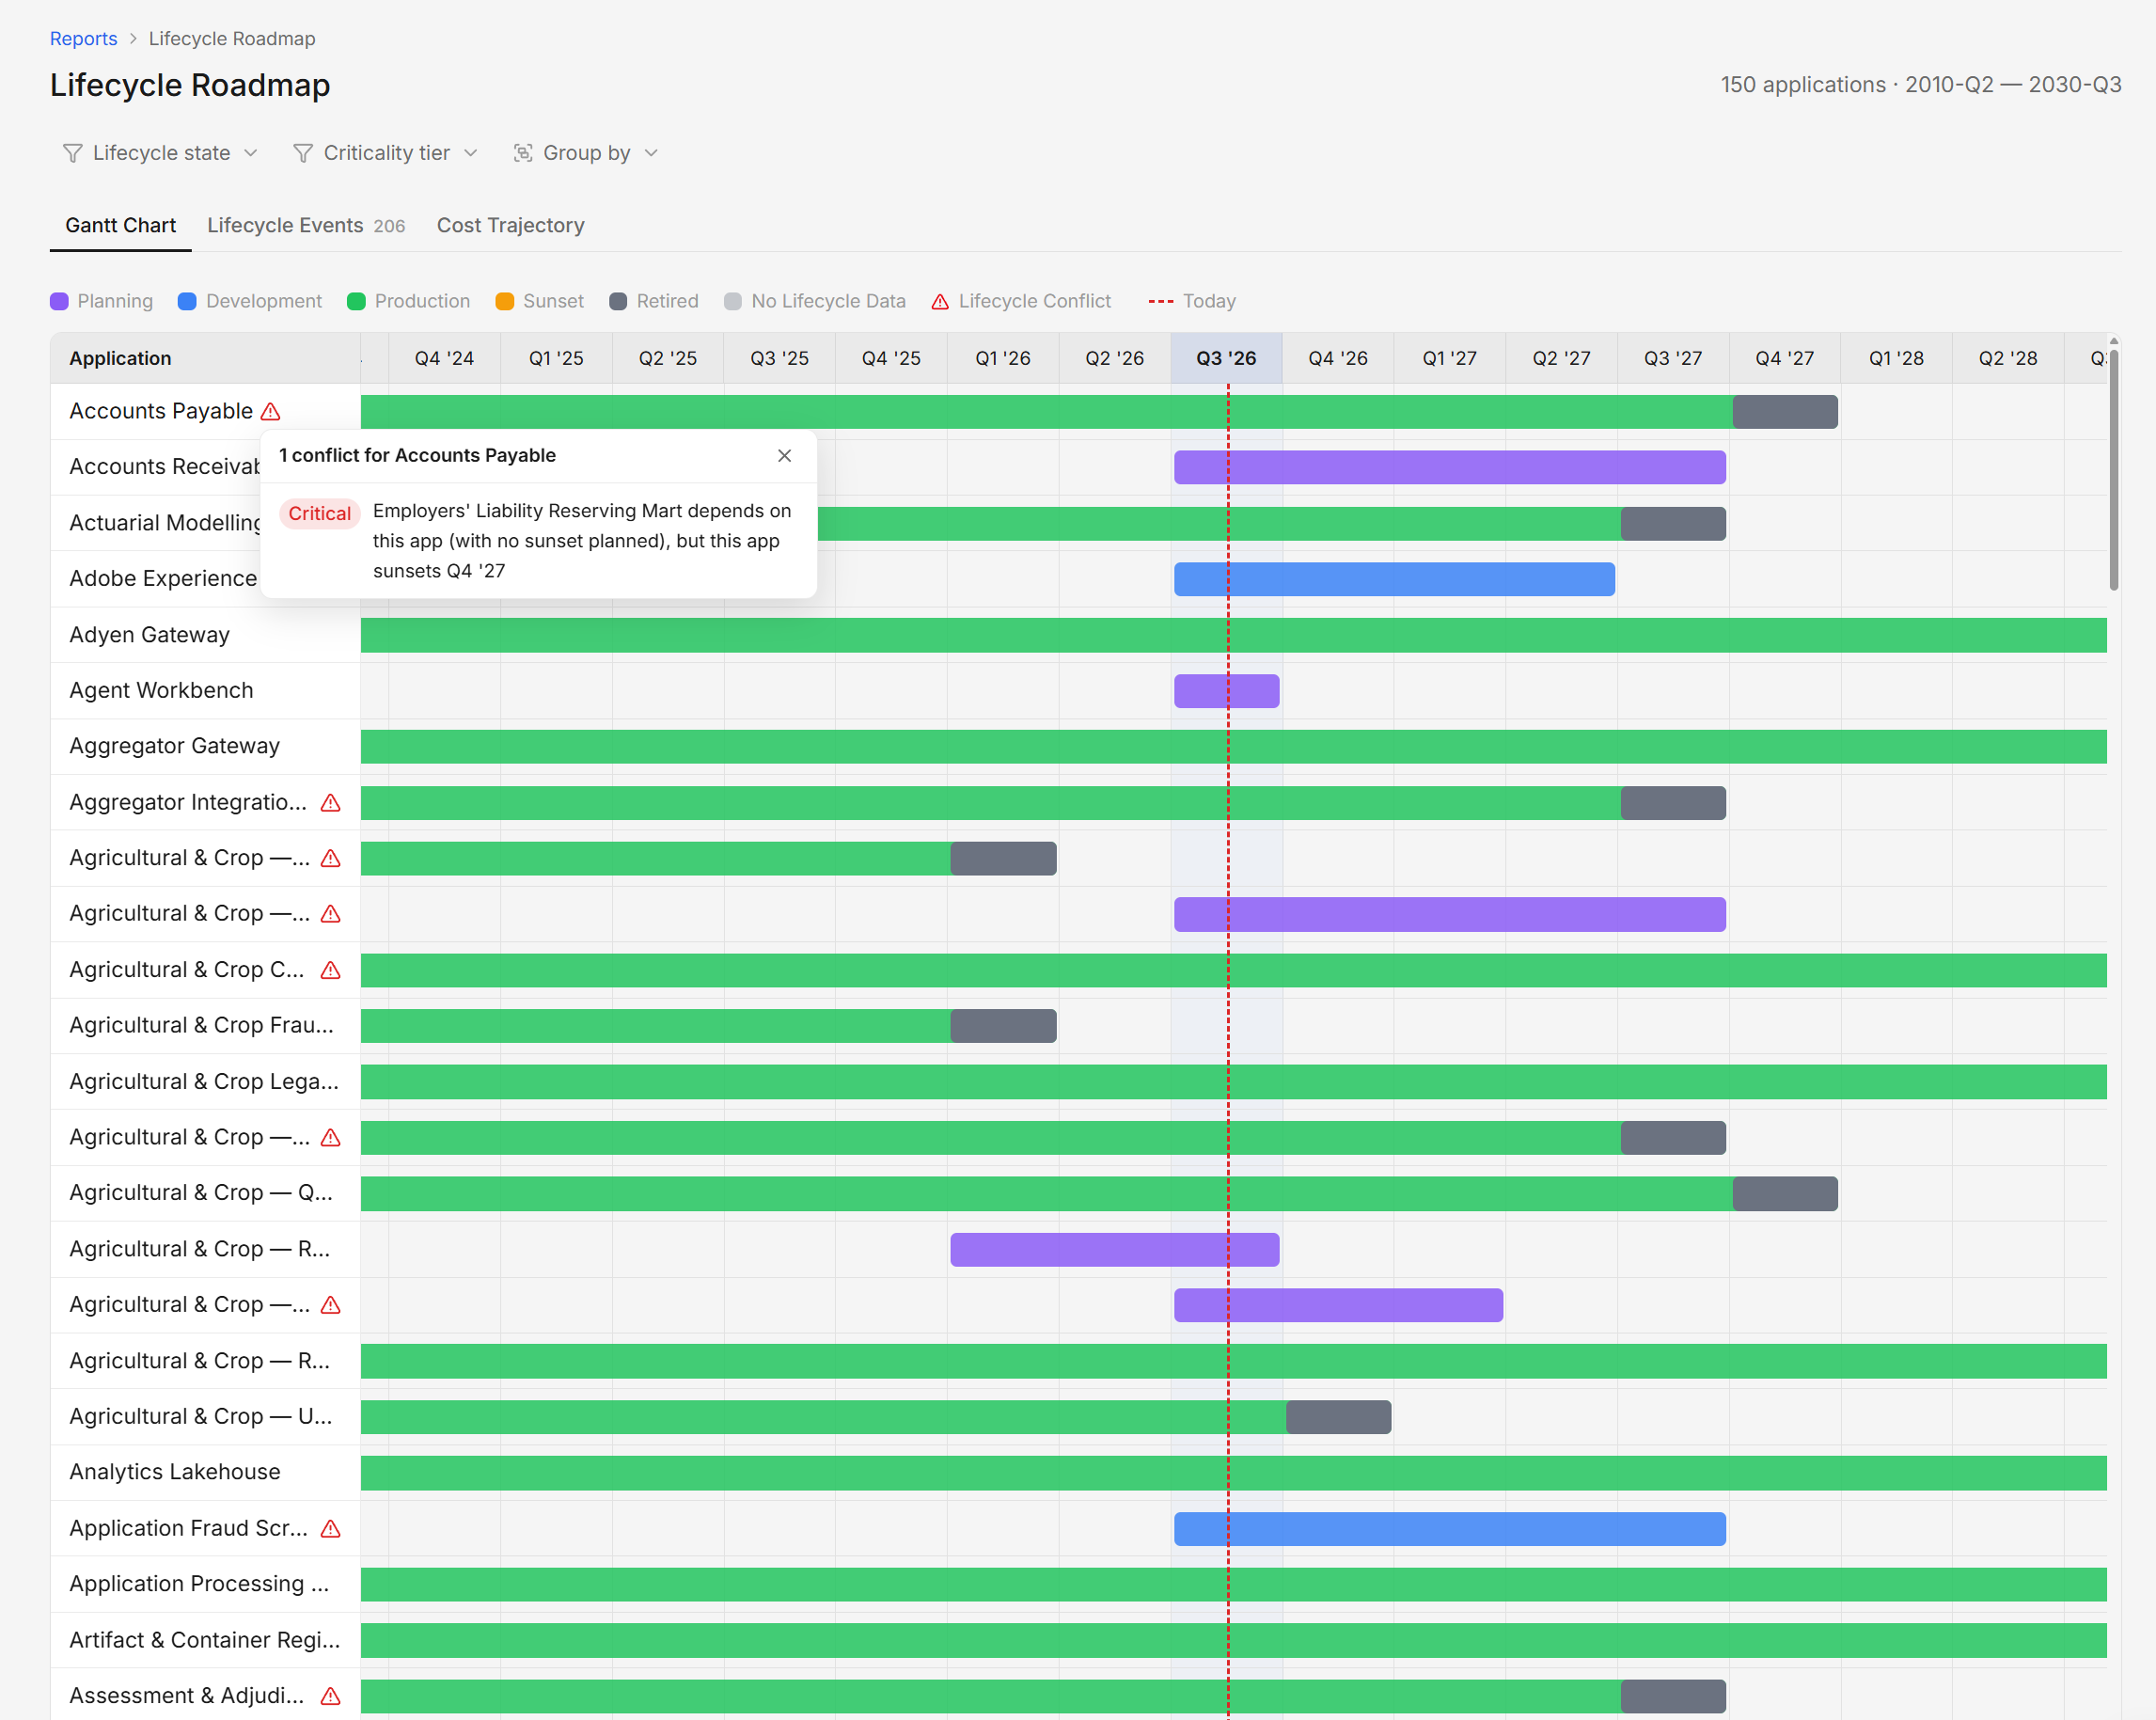
Project the portfolio’s cost trajectory by quarter as systems move from production to sunset. Model a transformation as an initiative and preview its blast radius and a three-year capex/opex payback before anyone touches production.
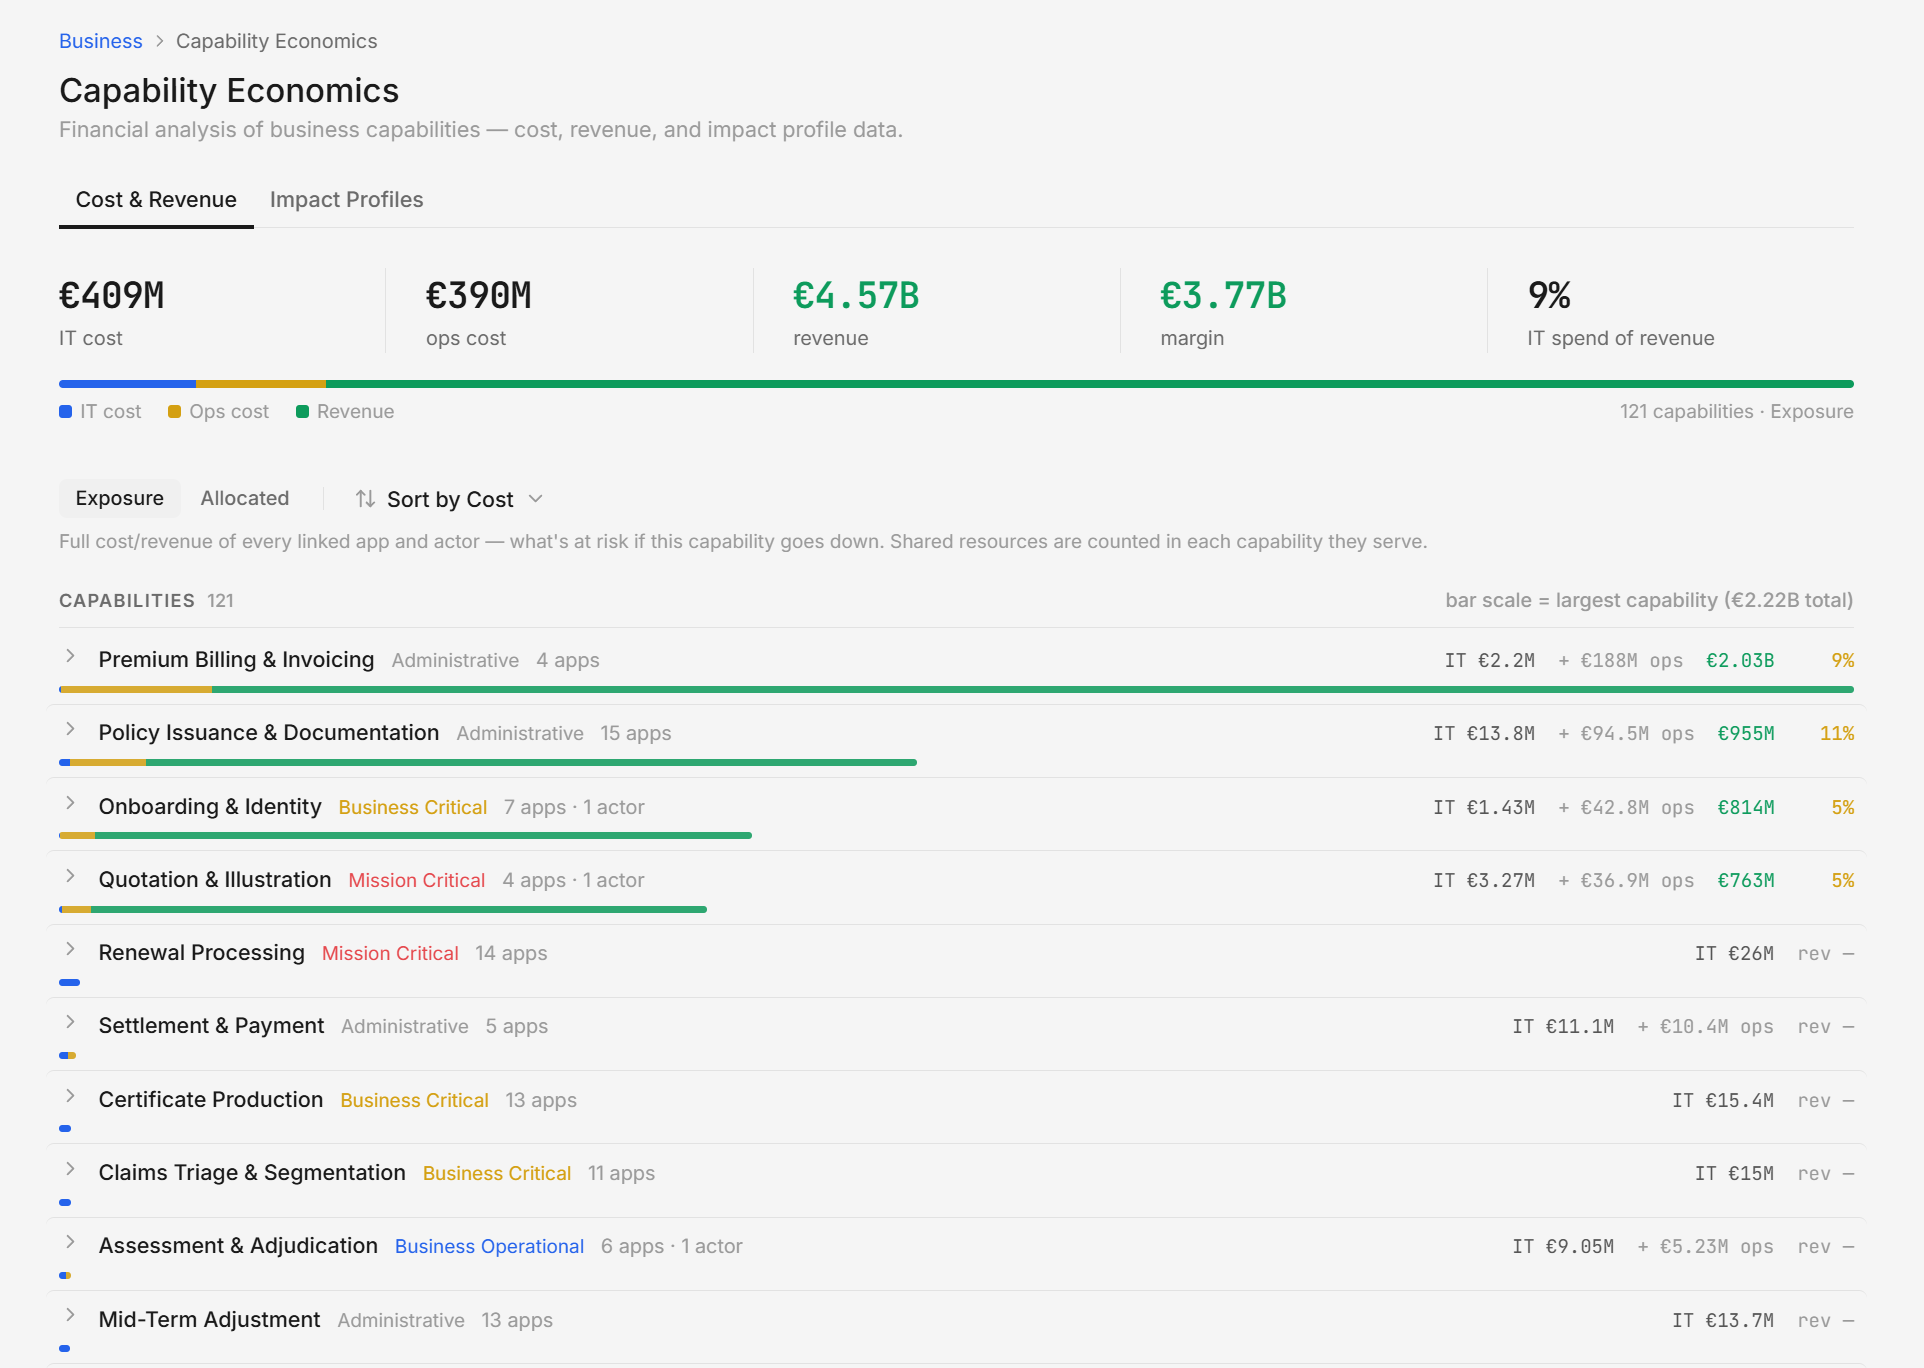
The business case writes itself — from your own numbers.
The blast radius is the ROI calculator
One prevented multi-hour outage of a revenue-critical capability can exceed a full year of Dependra — computed from the economics you authored, not a vendor benchmark.
Retire the right systems
Portfolio analysis scores every application and rolls up to portfolio medians, so rationalisation becomes a defensible map, not the loudest opinion.
A cost line on the roadmap
The lifecycle cost trajectory projects run-rate quarter by quarter, so the transformation plan finally has a number attached.
“On track” is a calculated number, not a colour picked on Friday.
Key results are computed from the live landscape — incident frequency, SLA penalty exposure, revenue at risk, IT spend. Initiatives carrying your CapEx / OpEx and ROI projection feed the objectives they belong to, so the board sees cost, risk and progress in one place.
Share a read-only cycle summary by link — no login, no deck. If a component under a key result degrades, the goal surfaces as at-risk automatically.
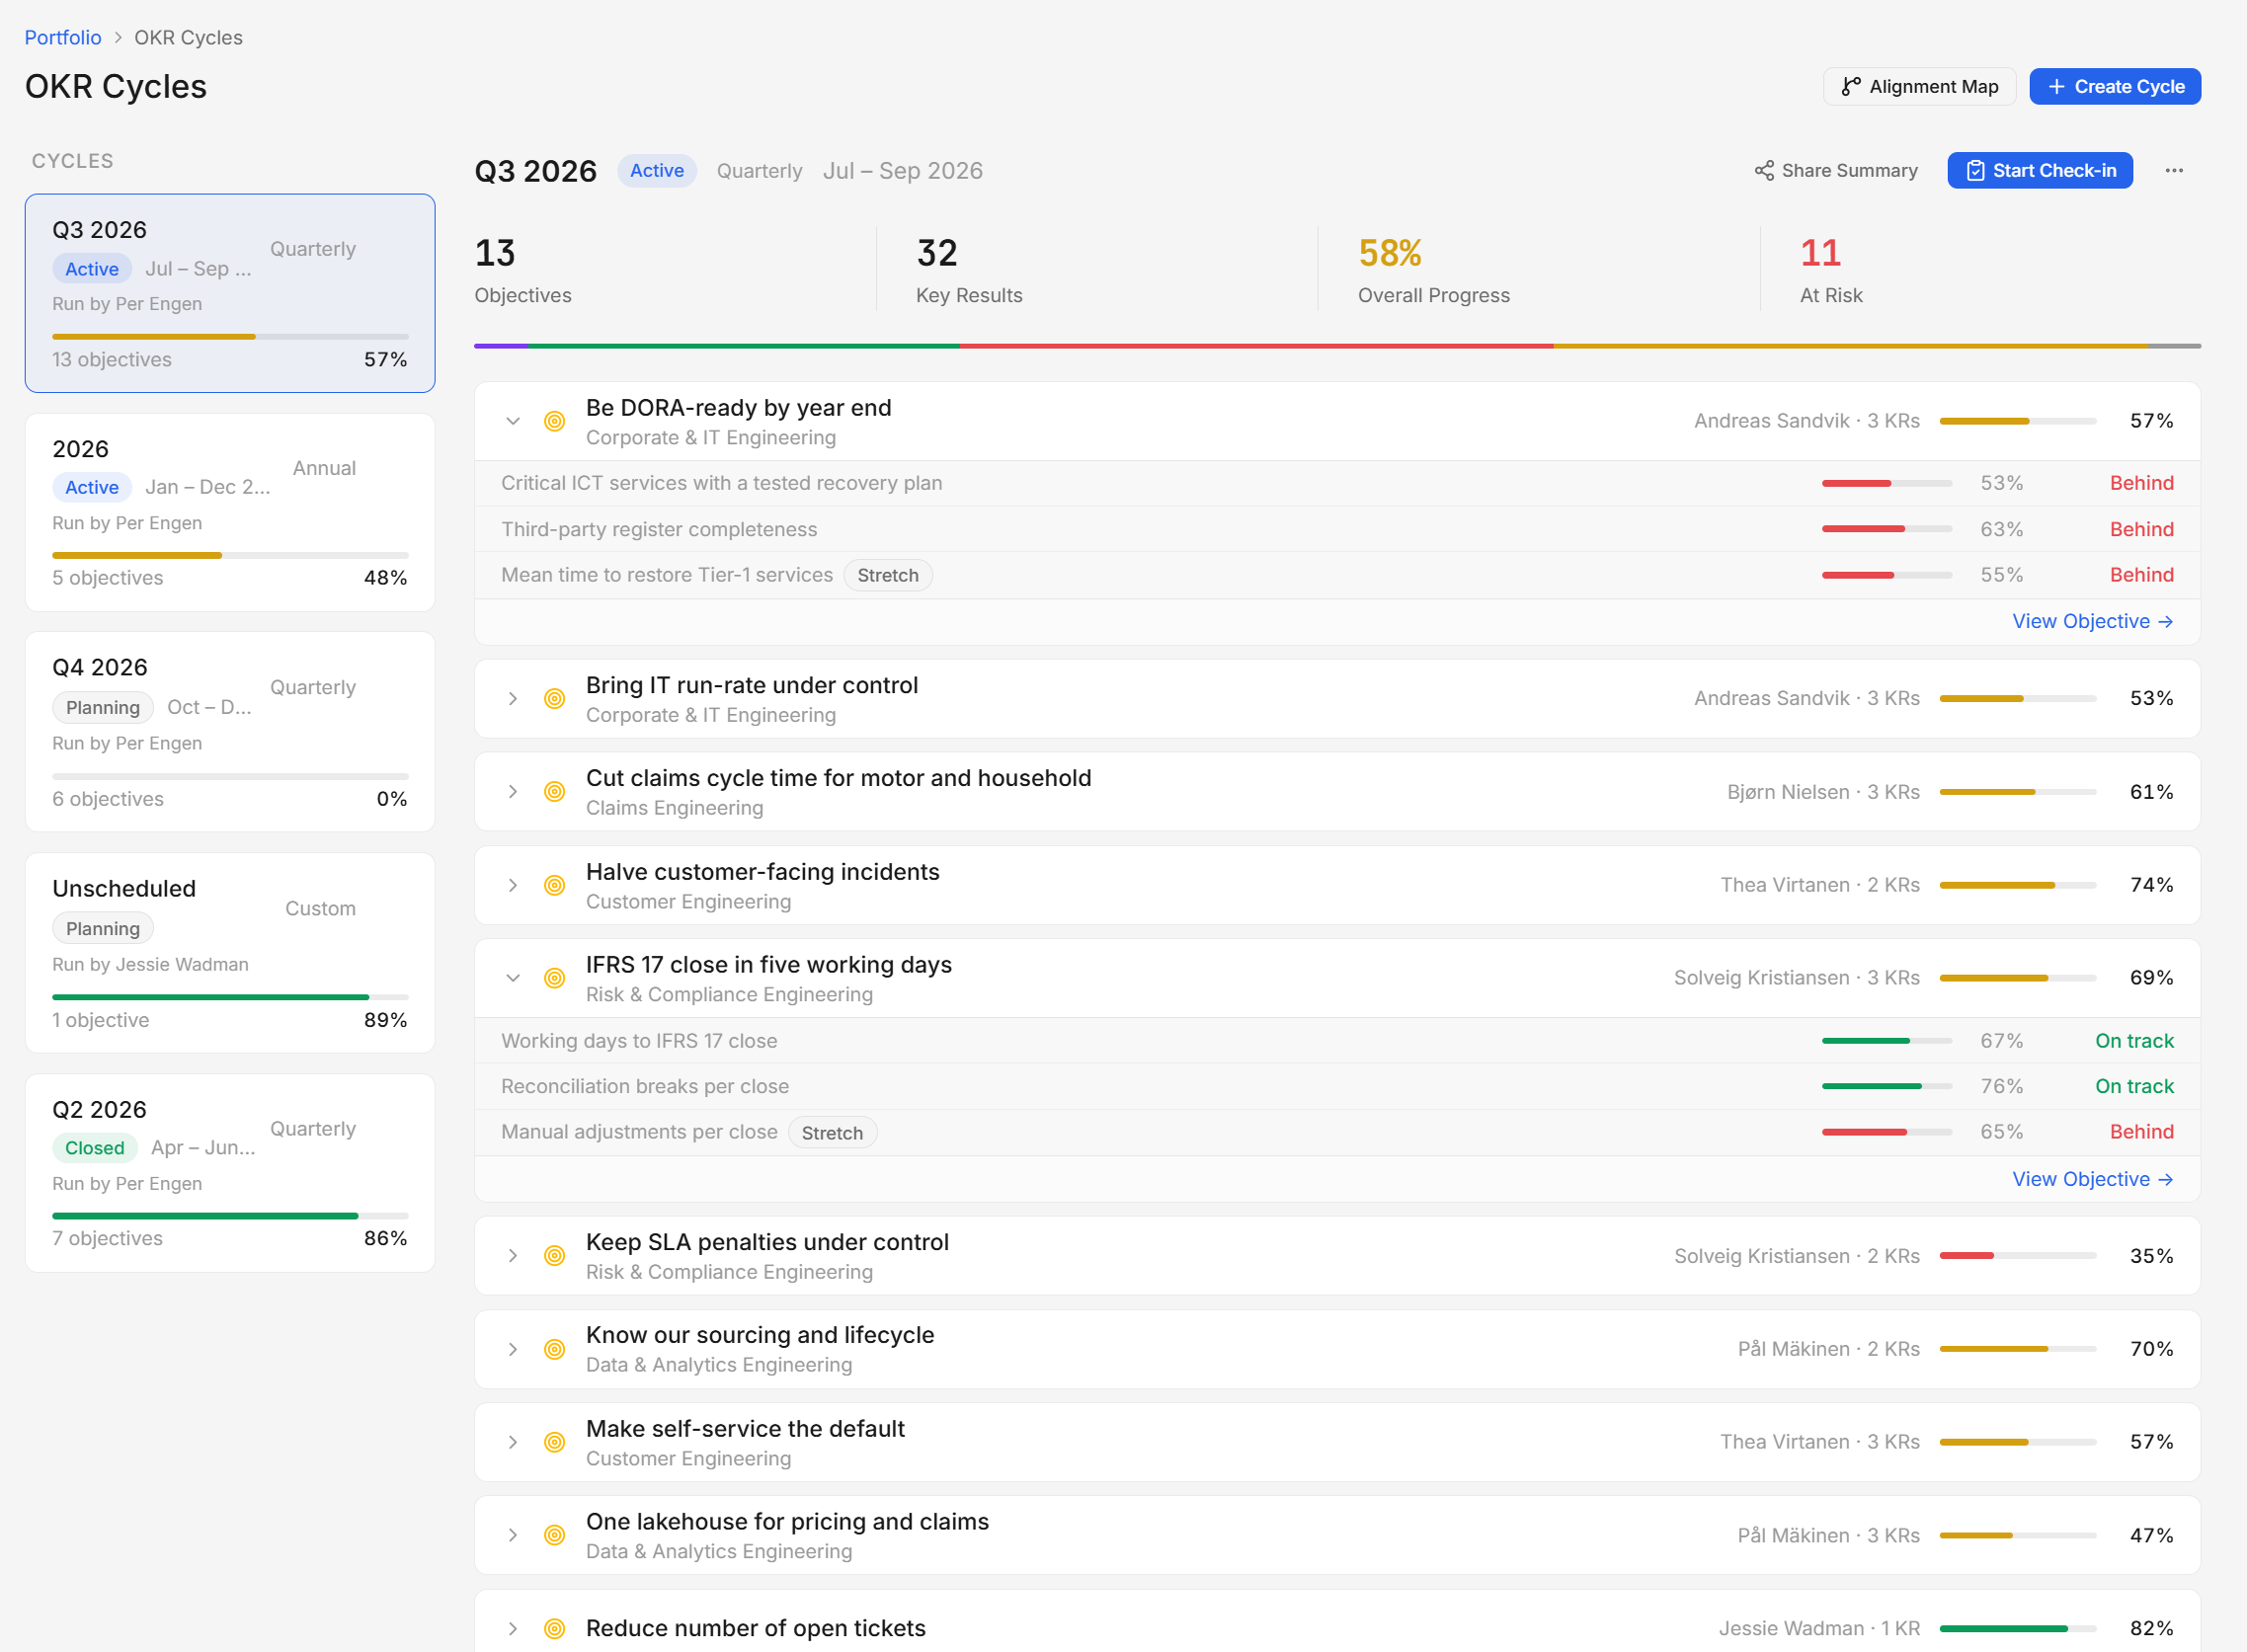
Your numbers, transparently rolled up.
Every financial figure is the rollup of the economics you entered. Dependra does the traversal and the maths; the business numbers are yours, and every score is decomposable. Revenue is need-to-know, gated by plan and a revenue-visibility permission.
Put a number on the roadmap.
Model a slice of your estate, allocate the economics you already know, and let Dependra roll it up into a board-ready cost and impact case.