
EA that answers the board's question.
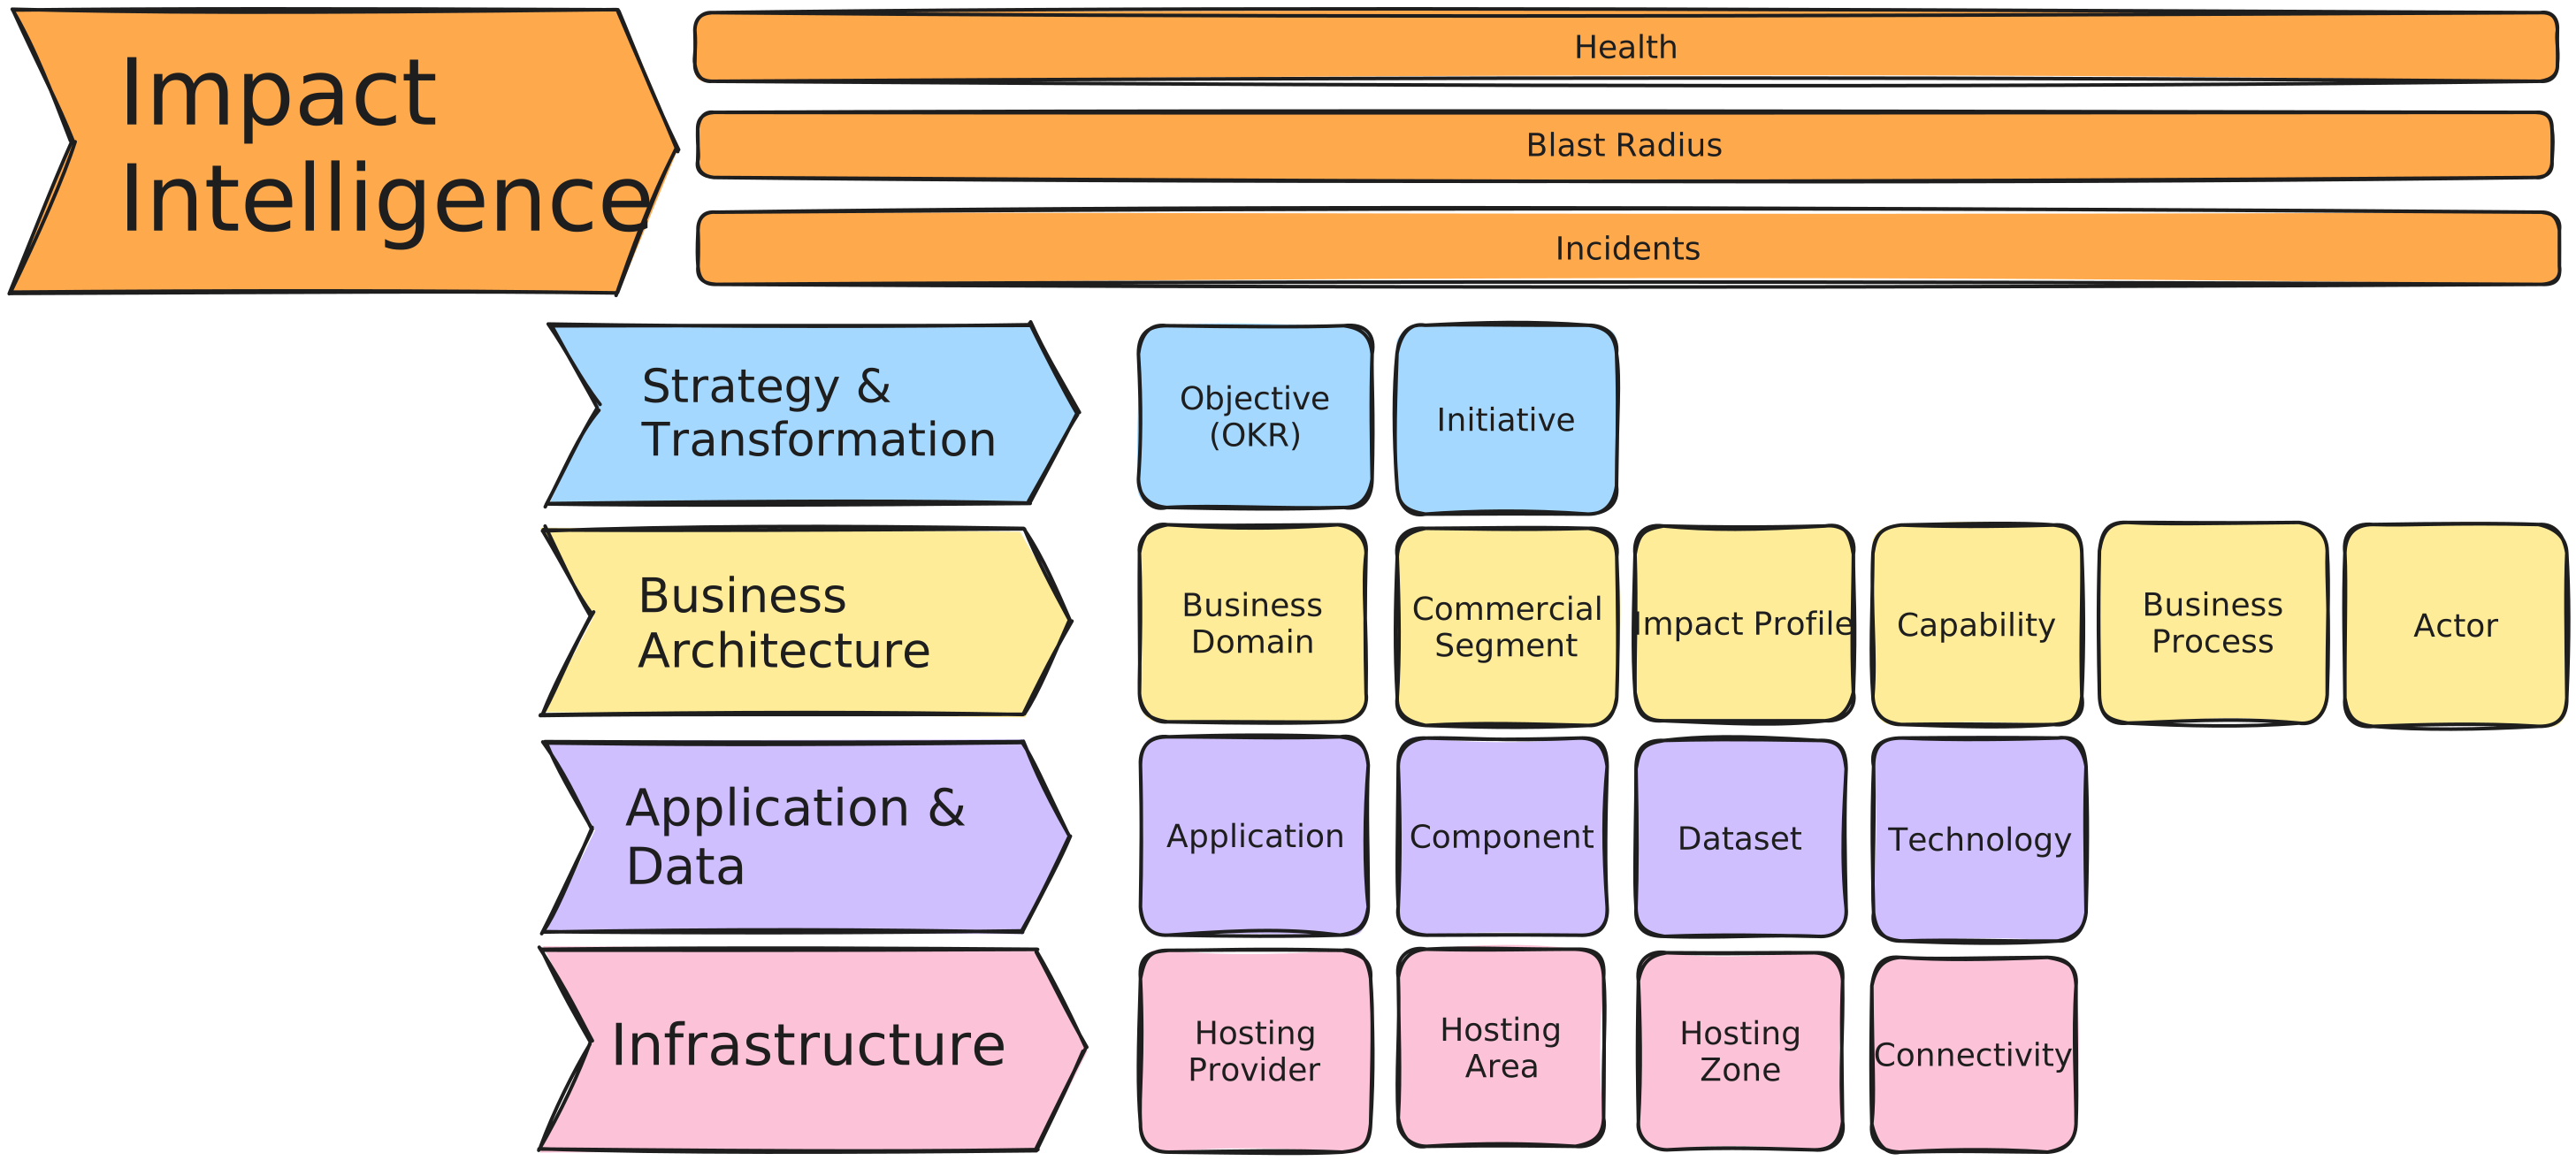
Enterprise architecture rebuilt around traversal — seven layers, one graph, both directions: a failure climbs from a firewall to the objective it threatens; a strategy question drills from an objective down to the exact component carrying it.
Quarterly reviews are where objectives go to die
Status theater. Numbers typed from memory by someone who just Slack-chased every team lead. A program manager spending Monday morning re-asking the same question: what's the actual number?
Dependra's key results pull from the landscape. Platform metrics — incident frequency, MTTR, SLA compliance, blast radius, tech debt ratio, GDPR exposure — update continuously from your live model. Jira feeds in on a scheduled sweep. External systems push in via a scoped API endpoint. And when a component goes Degraded, the key result it's scoped to flags At Risk automatically — with the component named. No chasing.
Cycles & carry-forward
Time-bound OKR periods — quarterly, annual or custom — move through a Planning → Active → Scoring → Closed lifecycle per team. Close a cycle and selected key results carry forward: start values re-baseline, goal expressions re-evaluate, lineage preserved.
Computed key results Enterprise
Pick one of 104 built-in platform metrics and the landscape does the measurement. Refreshed continuously from your live model — incidents, SLA compliance, tech debt, blast radius, GDPR exposure and more. Baseline locked at creation. 15 metric groups, no manual entry required.
Jira & API-fed key results
Connect Jira via Atlassian OAuth: JQL filter, issue count or story point mode, scheduled sweep. Or push from anything — Datadog, Salesforce, a CI gate — via a scoped API key. The ingest endpoint accepts value, status and comment.
Computed risk signals
Active incident on a scoped component: Critical. Degraded health: Warning. Linked initiative stalled 14+ days: Warning. High blast-radius dependency: Warning. Trajectory 30 points behind: Critical. At risk is computed, not a dropdown.
Cross-team alignment map
A team objective can carry an organisation-level one — across teams, across cycles. The alignment map shows the whole picture: each team a row, each objective a card with live progress, contribution lines between them. Leadership sees how every goal ladders up — and which branch is slipping.
Shareable board summaries
Generate a secure-token link — no login required, optional email delivery, expiry date set by you. Leadership sees objective status computed from reality, not assembled by a program manager the night before the all-hands.
Your monitoring stack is the input layer
Datadog, Grafana, Zabbix, checkmk — whatever watches your estate feeds Dependra. Health signals enter at the infrastructure layer and surface seven layers up: through components, applications, business processes and capabilities, all the way to the objectives they threaten. You don't rip out your monitoring. You add the answer to the "so what."
The same path runs in reverse at strategy time: an objective question — "which component is the load-bearing pillar for this key result?" — drills straight down through the graph to the infrastructure that carries it. Blast radius, health, incidents: all in scope.
What Dependra is not
- Not a monitoring tool. We receive health status and compute impact. You bring Datadog, Grafana, Zabbix or checkmk — we answer the "so what?" seven layers up.
- Not an ITSM. We enrich the impact snapshot and surface it where decisions happen. We don't run on-call routing or ticketing.
- Not an OKR ceremony suite. No enforced scoring rubrics, no grading rituals, no mandatory methodology. Bring your own cadence, bring your own definition of good. The platform measures; you decide.
OKRs & Key Results is an Enterprise-tier capability. Initiative linkage, cycles and alignment map are included. Computed key results and risk signals require the OKR feature to be enabled on your plan.
Wire your first objective to the landscape
Start your trial and connect a key result to a platform metric or a live health signal. No payment required to trial.
Start free trial