
Know who cares and what it costs before the bridge call fills up.
Your monitoring says the database is down. Dependra says it just put €40,000 an hour of checkout revenue at stake and started the SLA clock on your highest-priority contract. That is the difference between “something's red” and a decision.
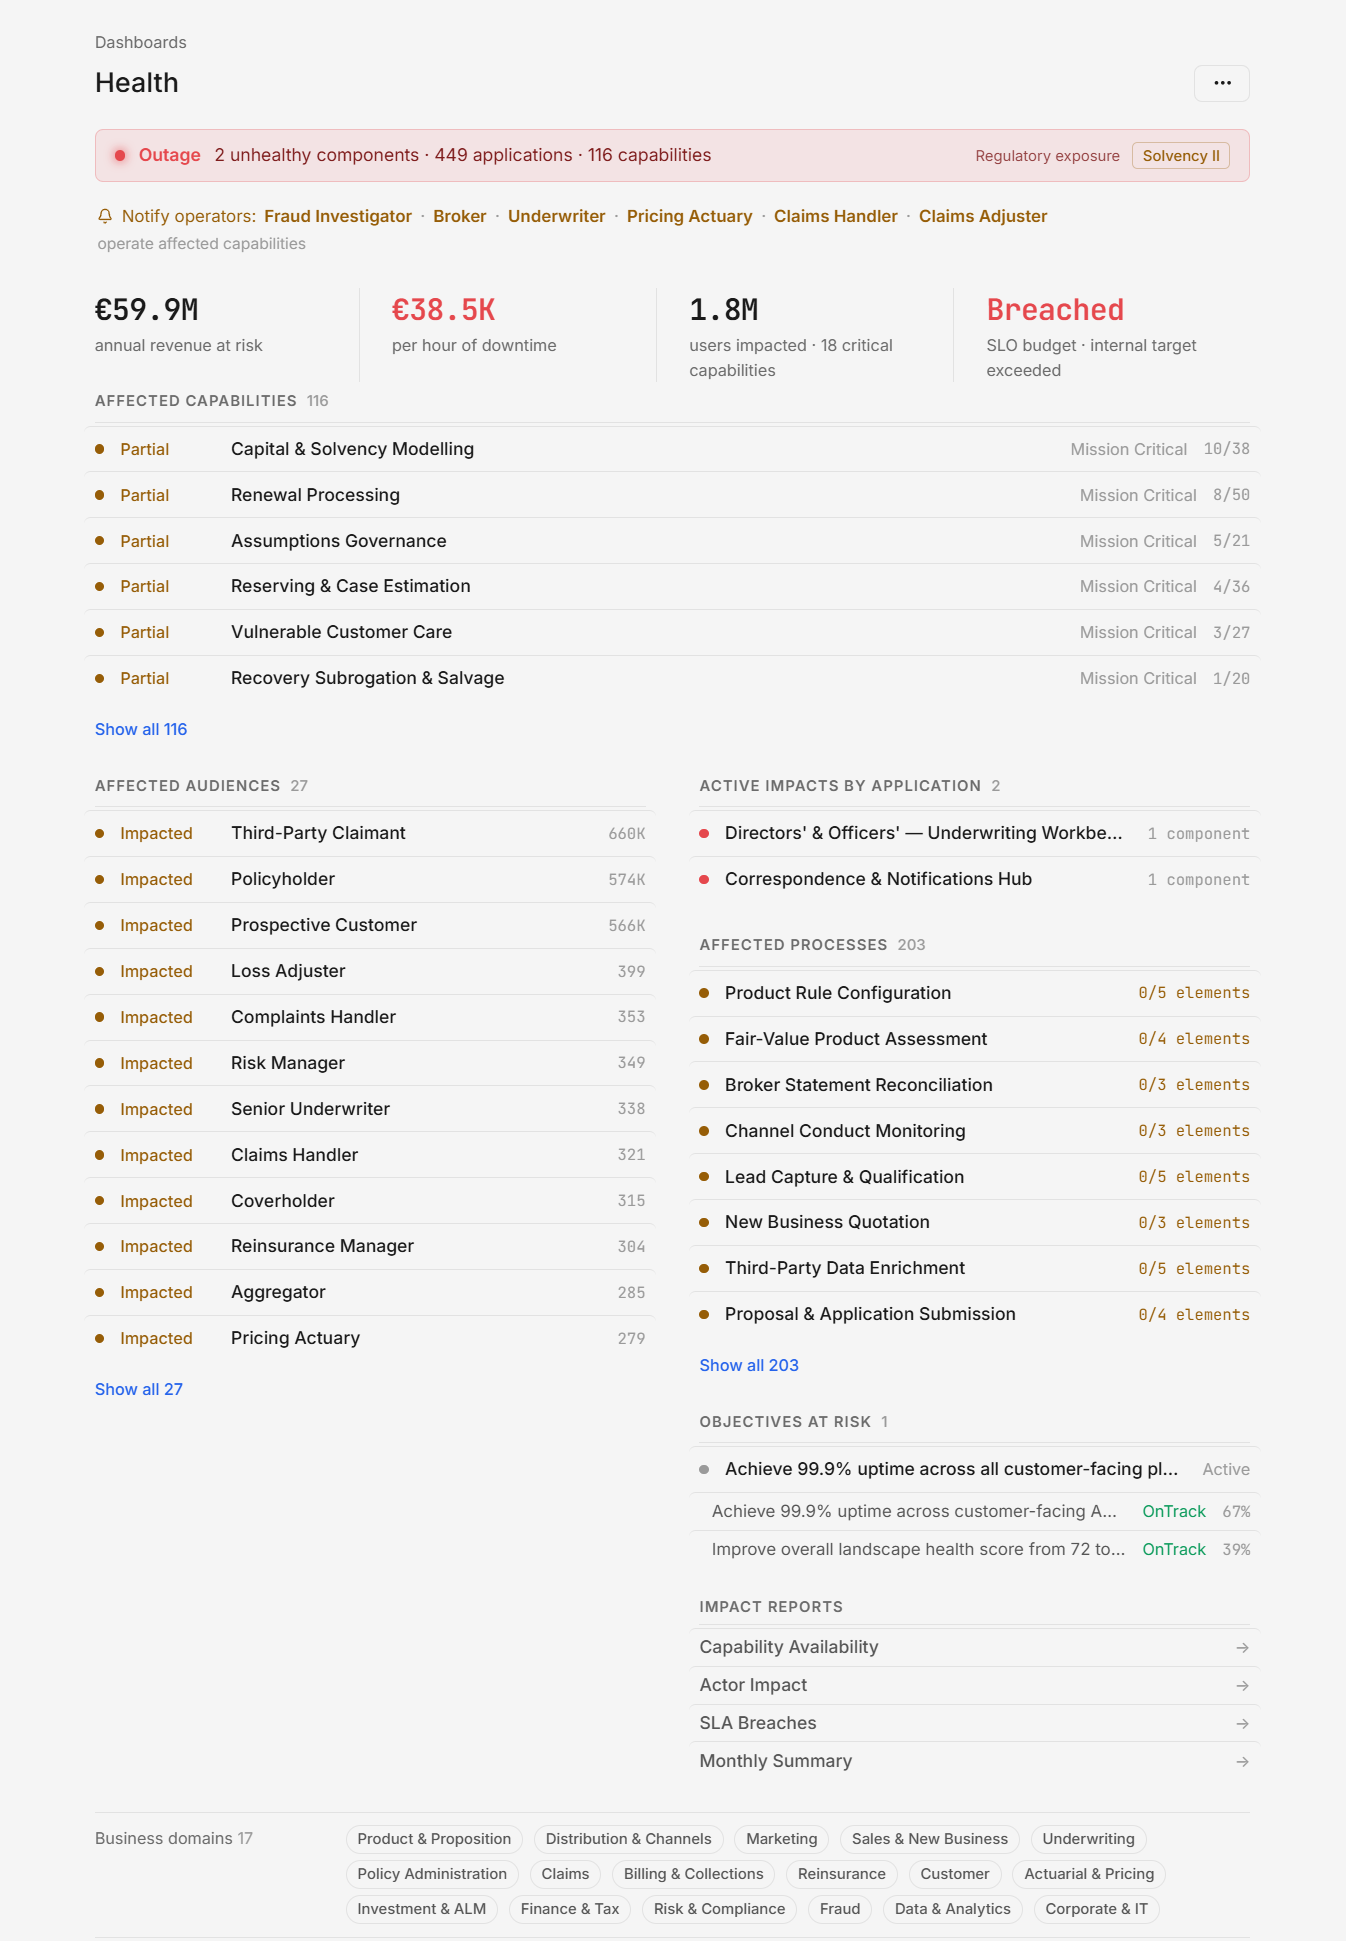
From a red dashboard to a board-ready answer.
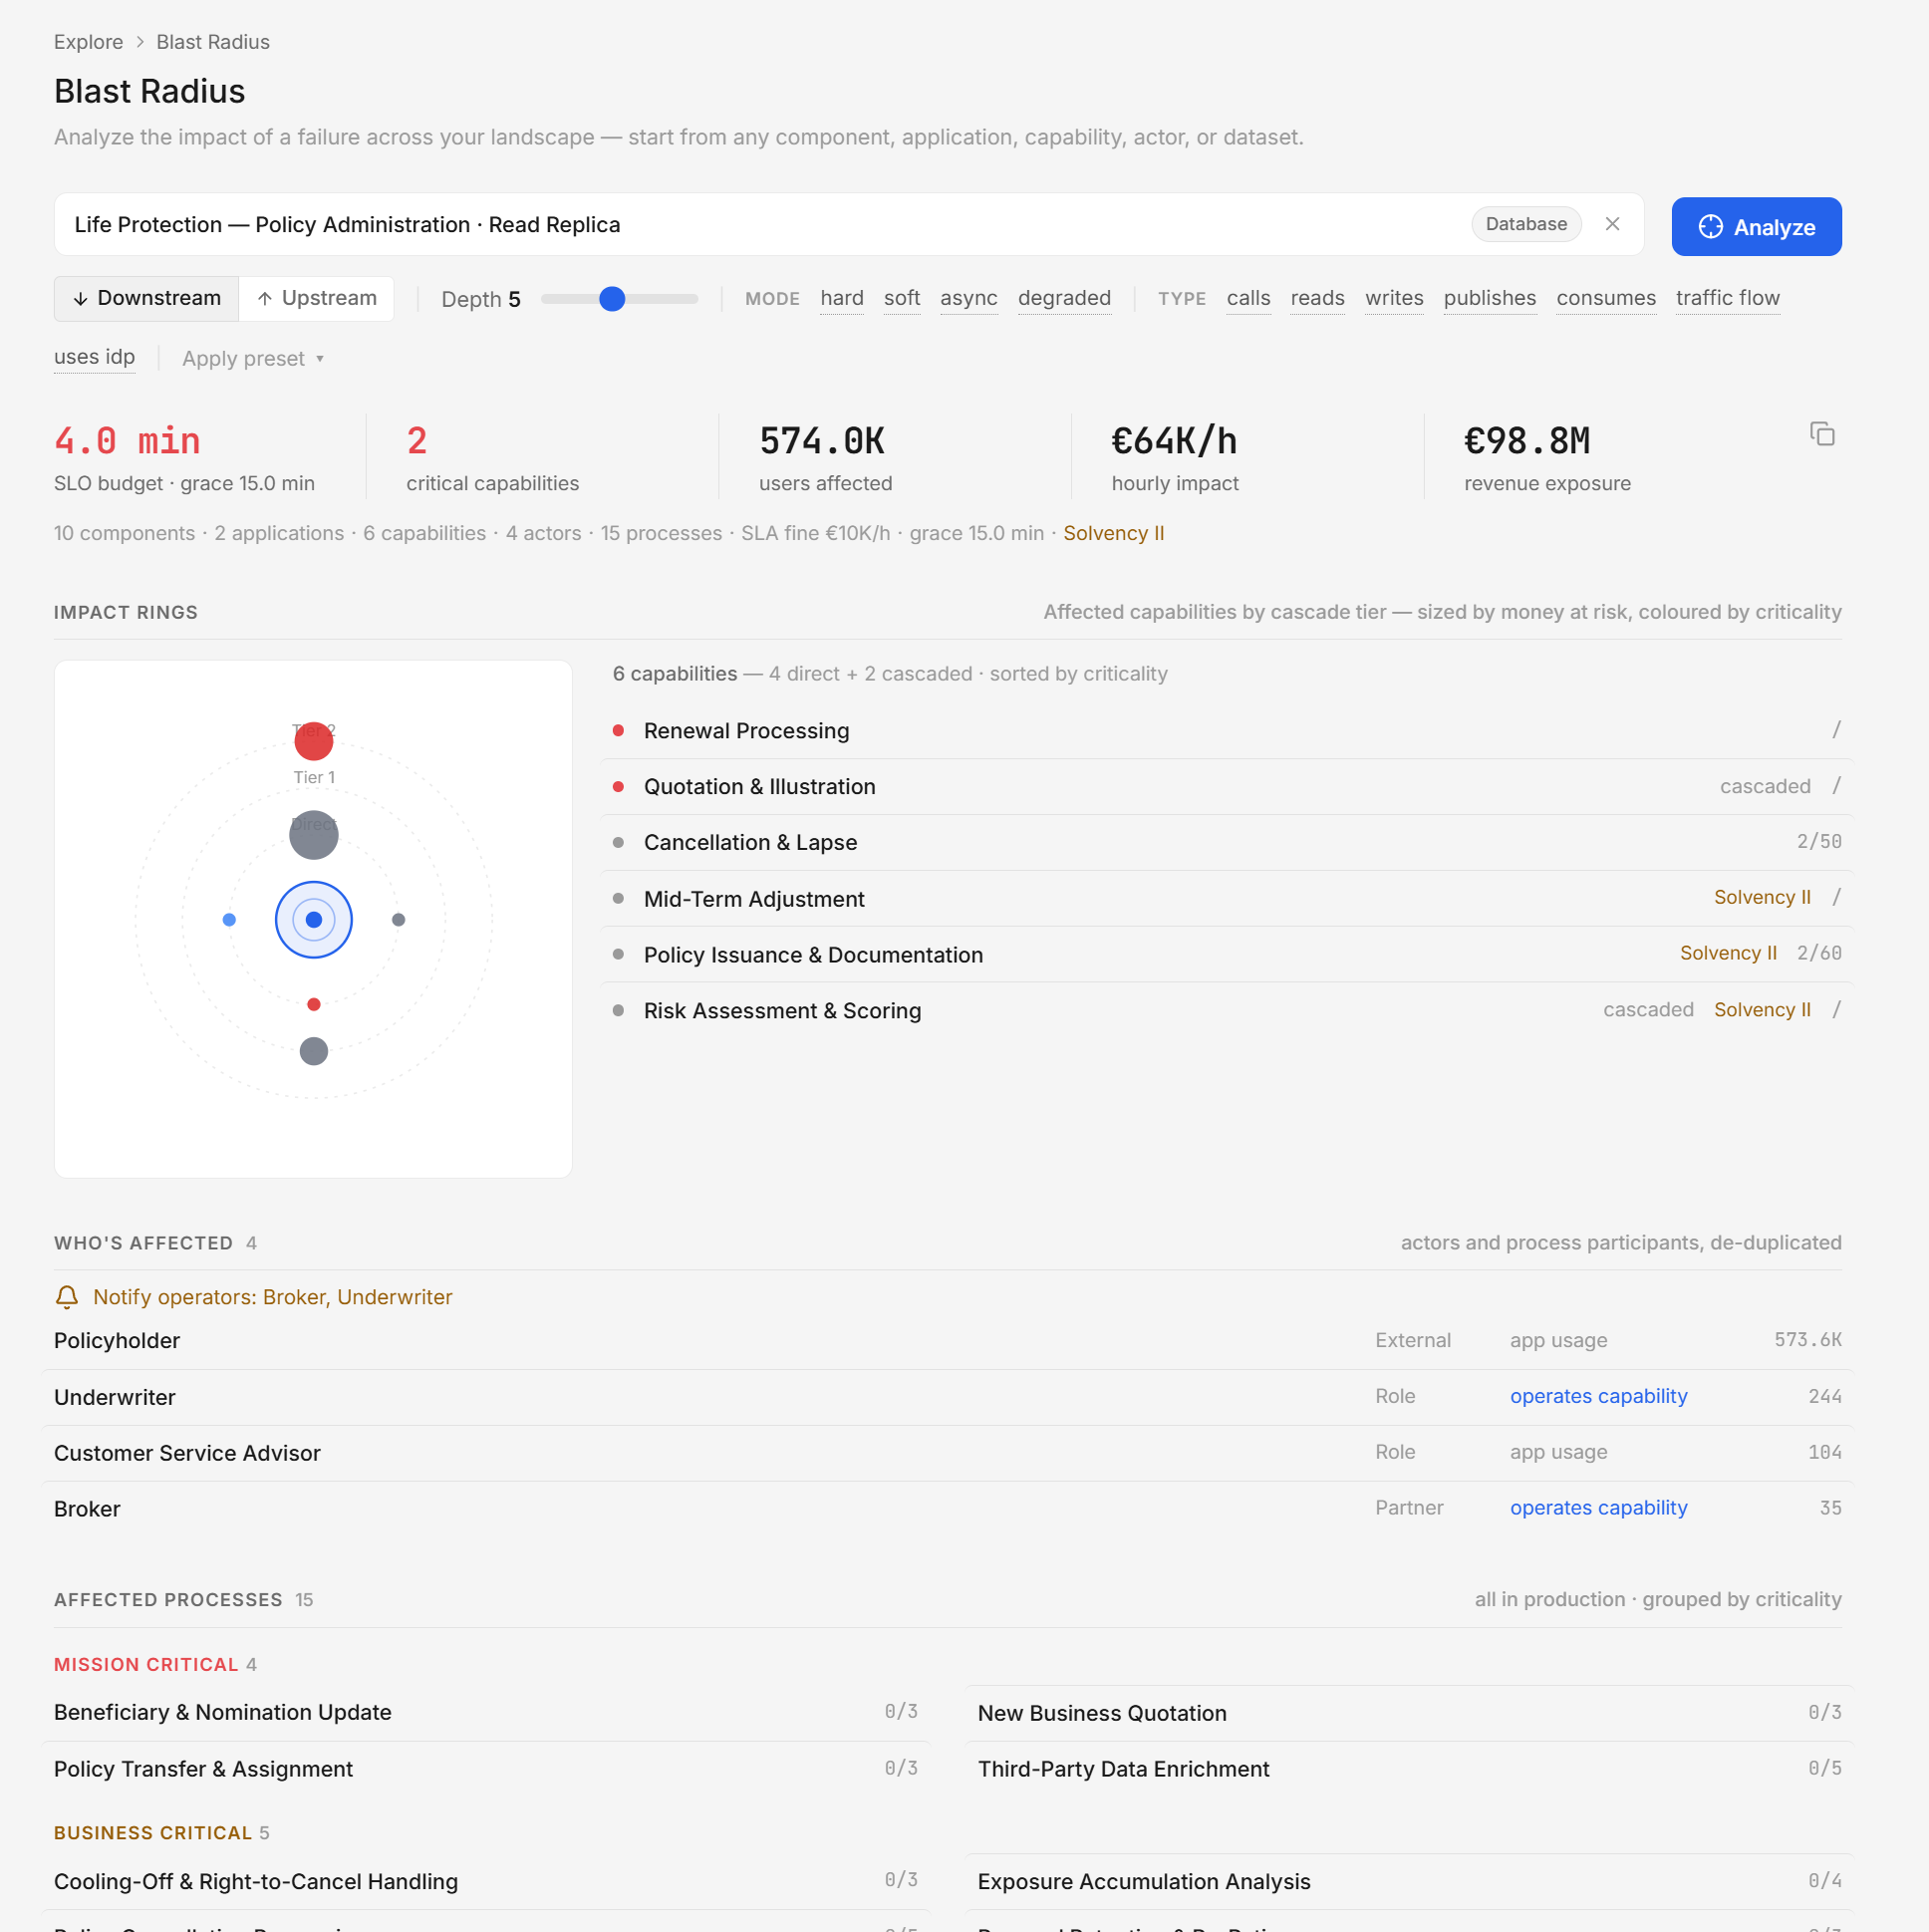
Start from any component, application, dataset, process or capability. Dependra traverses the live graph downstream and upstream — including the auth providers, brokers and zones your diagrams forget — and rolls the result up into business terms.
Downstream & upstream traversal
What breaks if this fails, and what could cause it. Depth bounded per plan for predictable queries.
Rolled up to the business
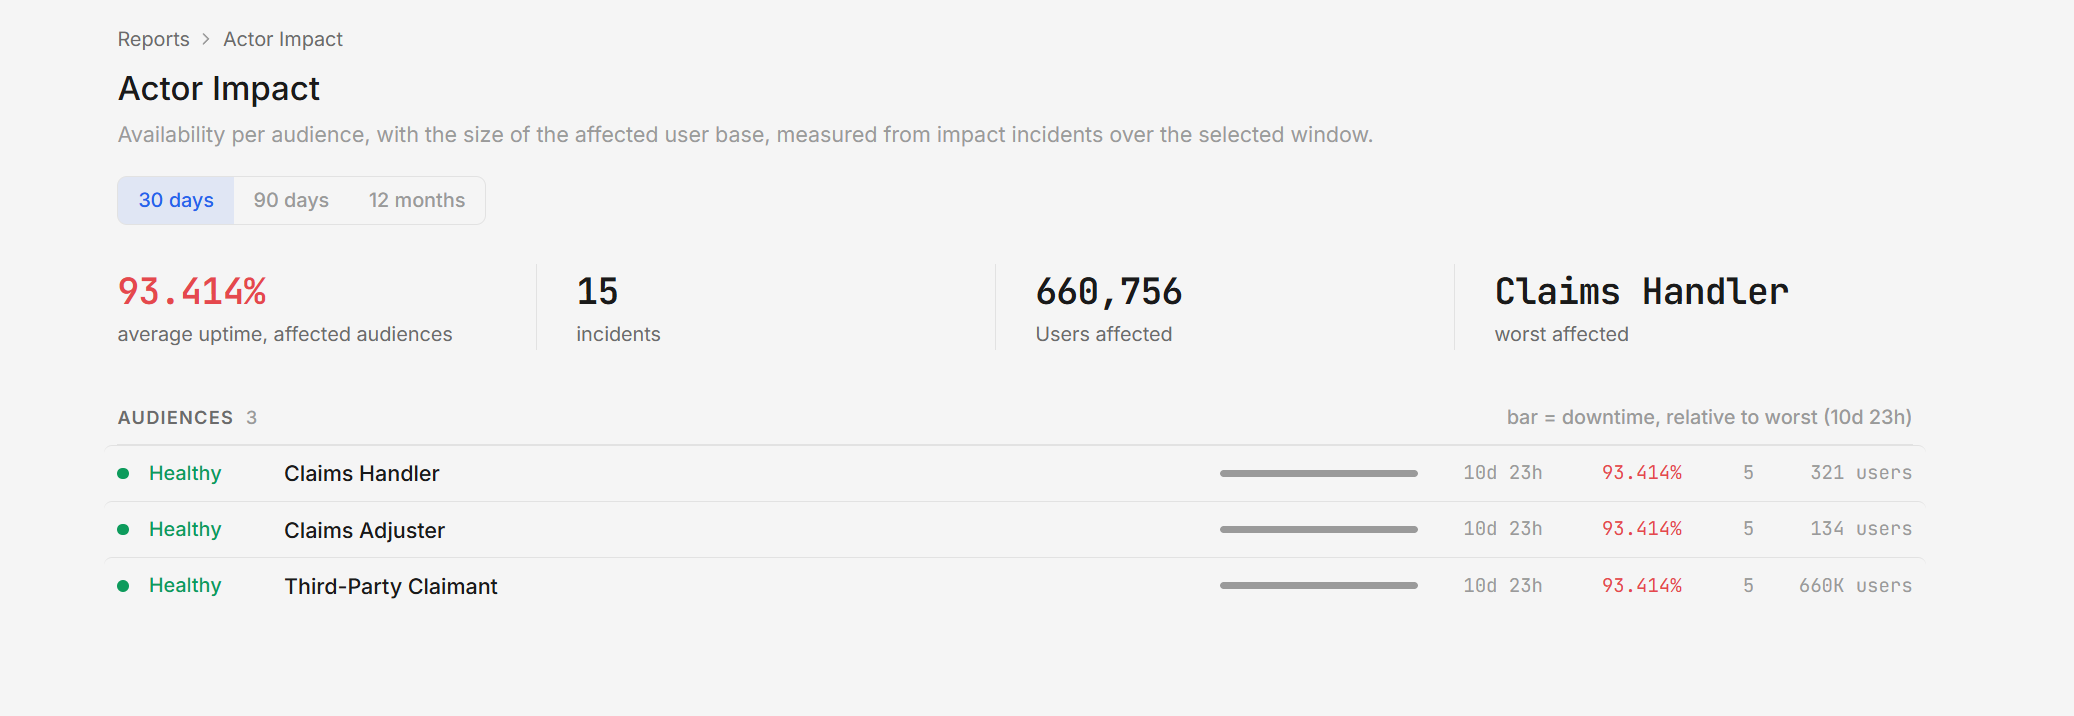
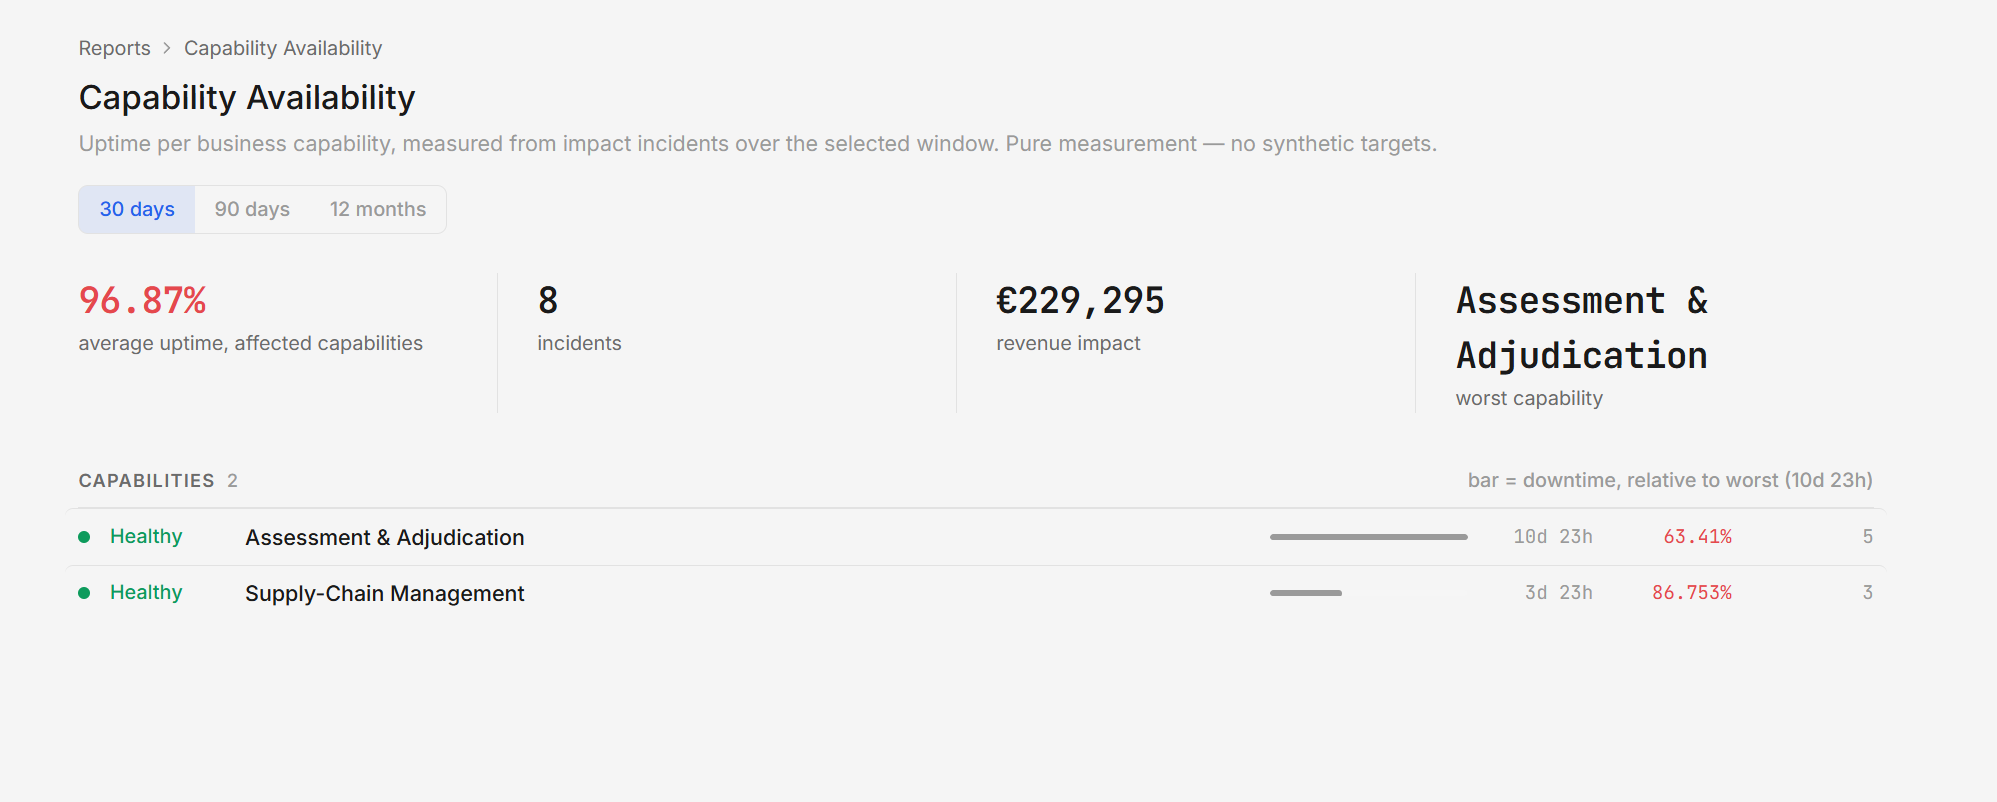
Affected applications, capabilities, audiences and user counts — impact in people and functions.
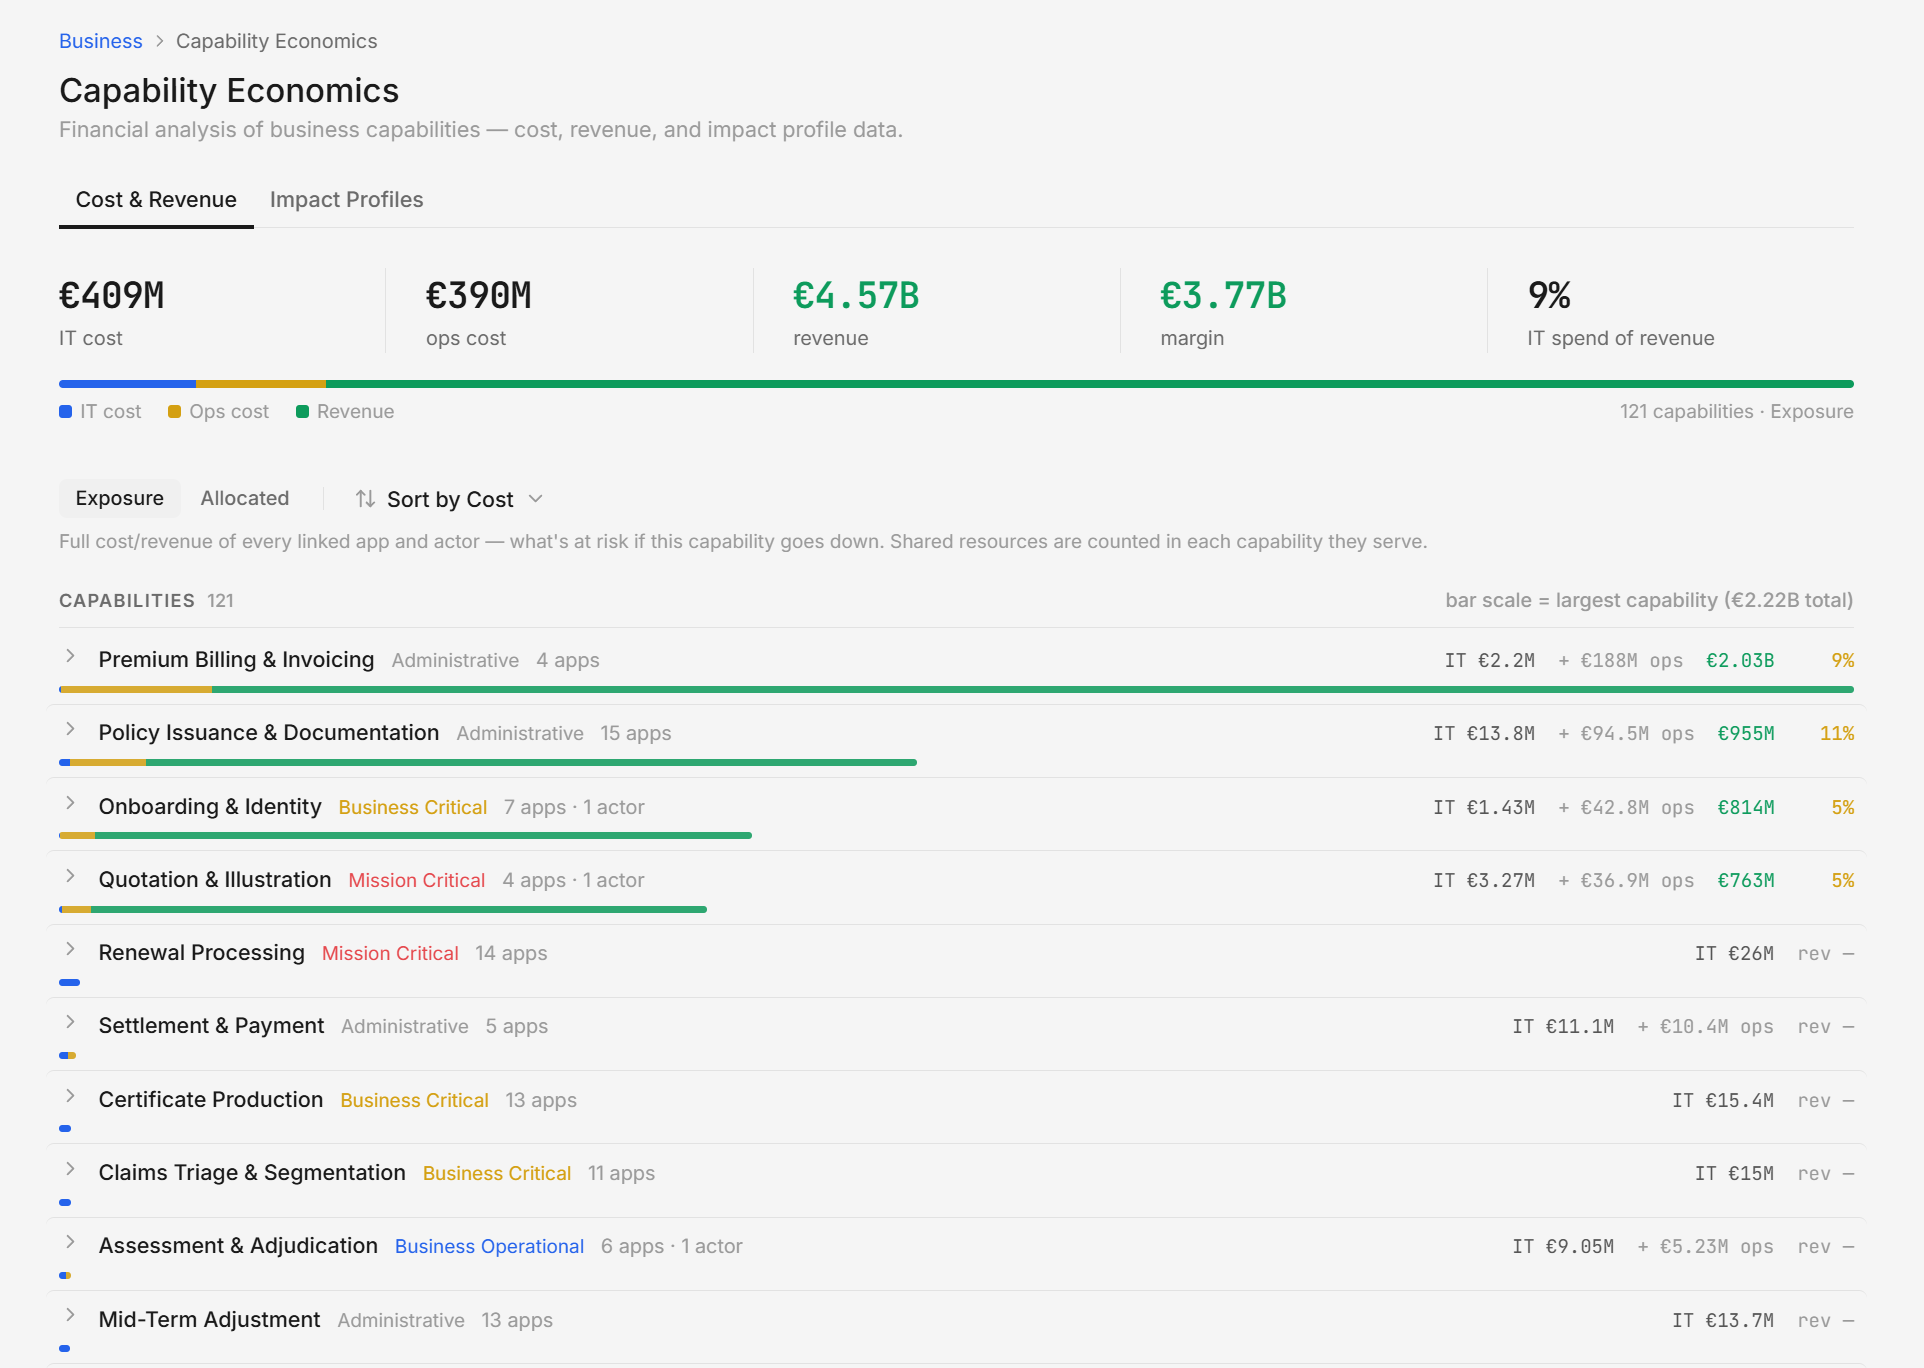
Revenue exposure per hour
Rolled up from the value-stream economics you authored. Revenue visibility is need-to-know.
SLA-breach horizon
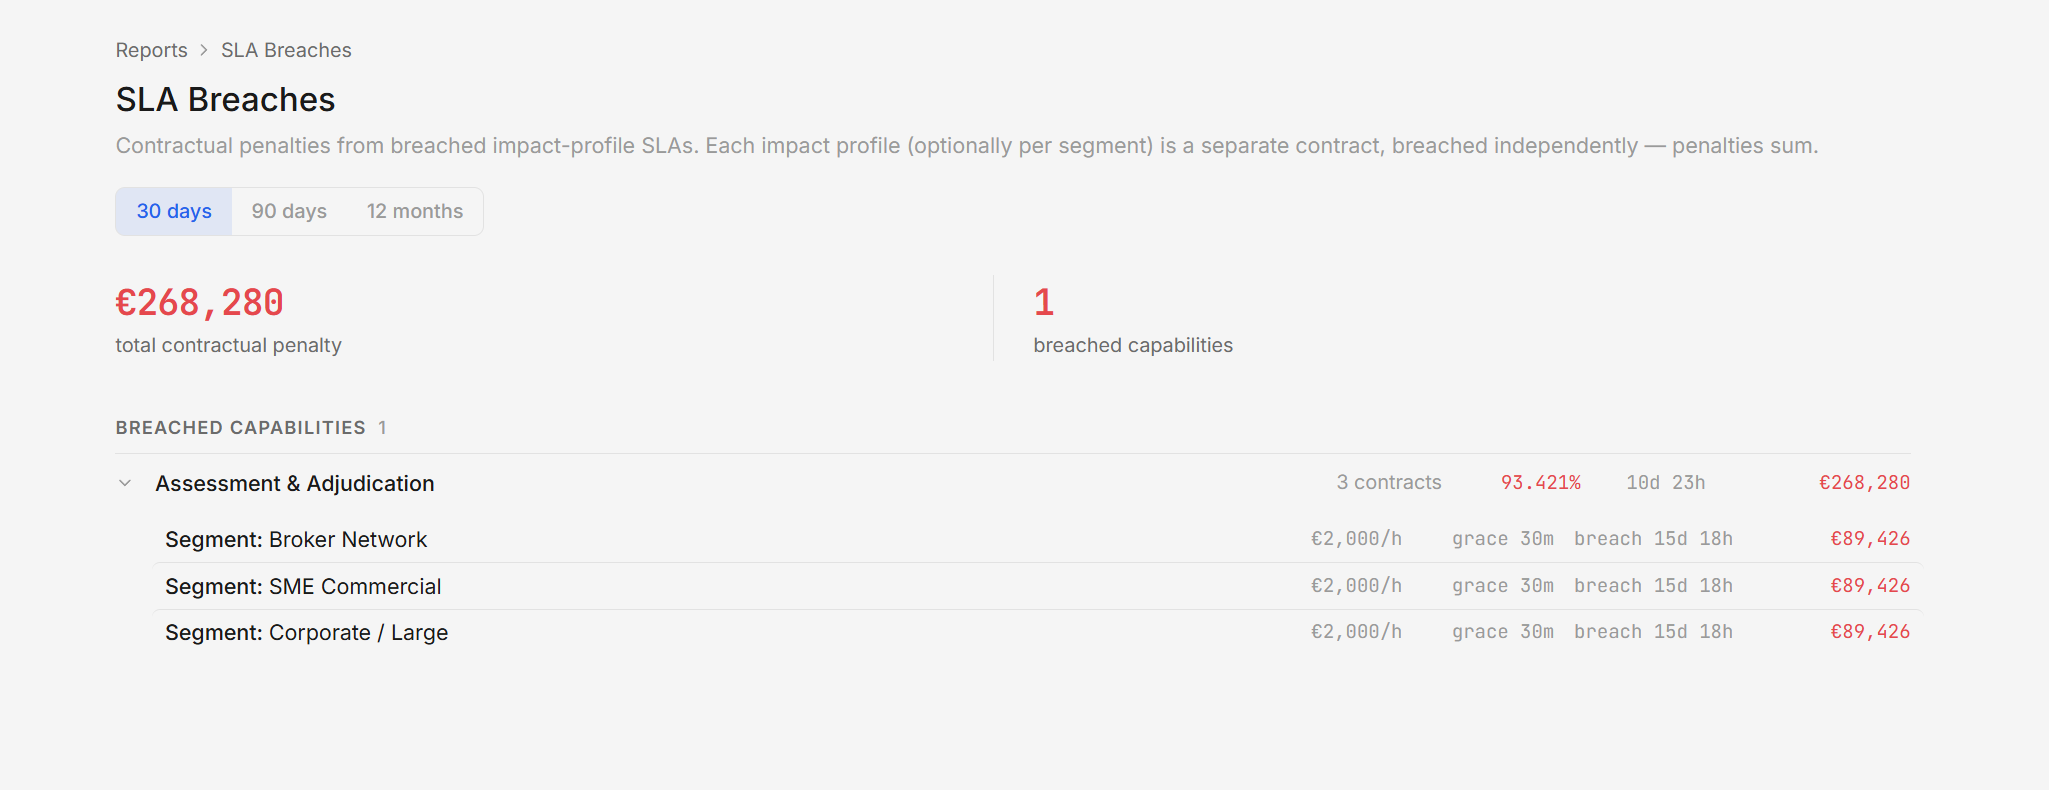
The earliest contractual threshold in reach, per segment, each with its own grace period and penalty.
Regulatory exposure
Whether regulated data and capabilities are in scope — in the first five minutes, not the post-mortem.
Current impact, live
The same rollup runs continuously off live component health.
The outage isn't over until you can explain what it cost.
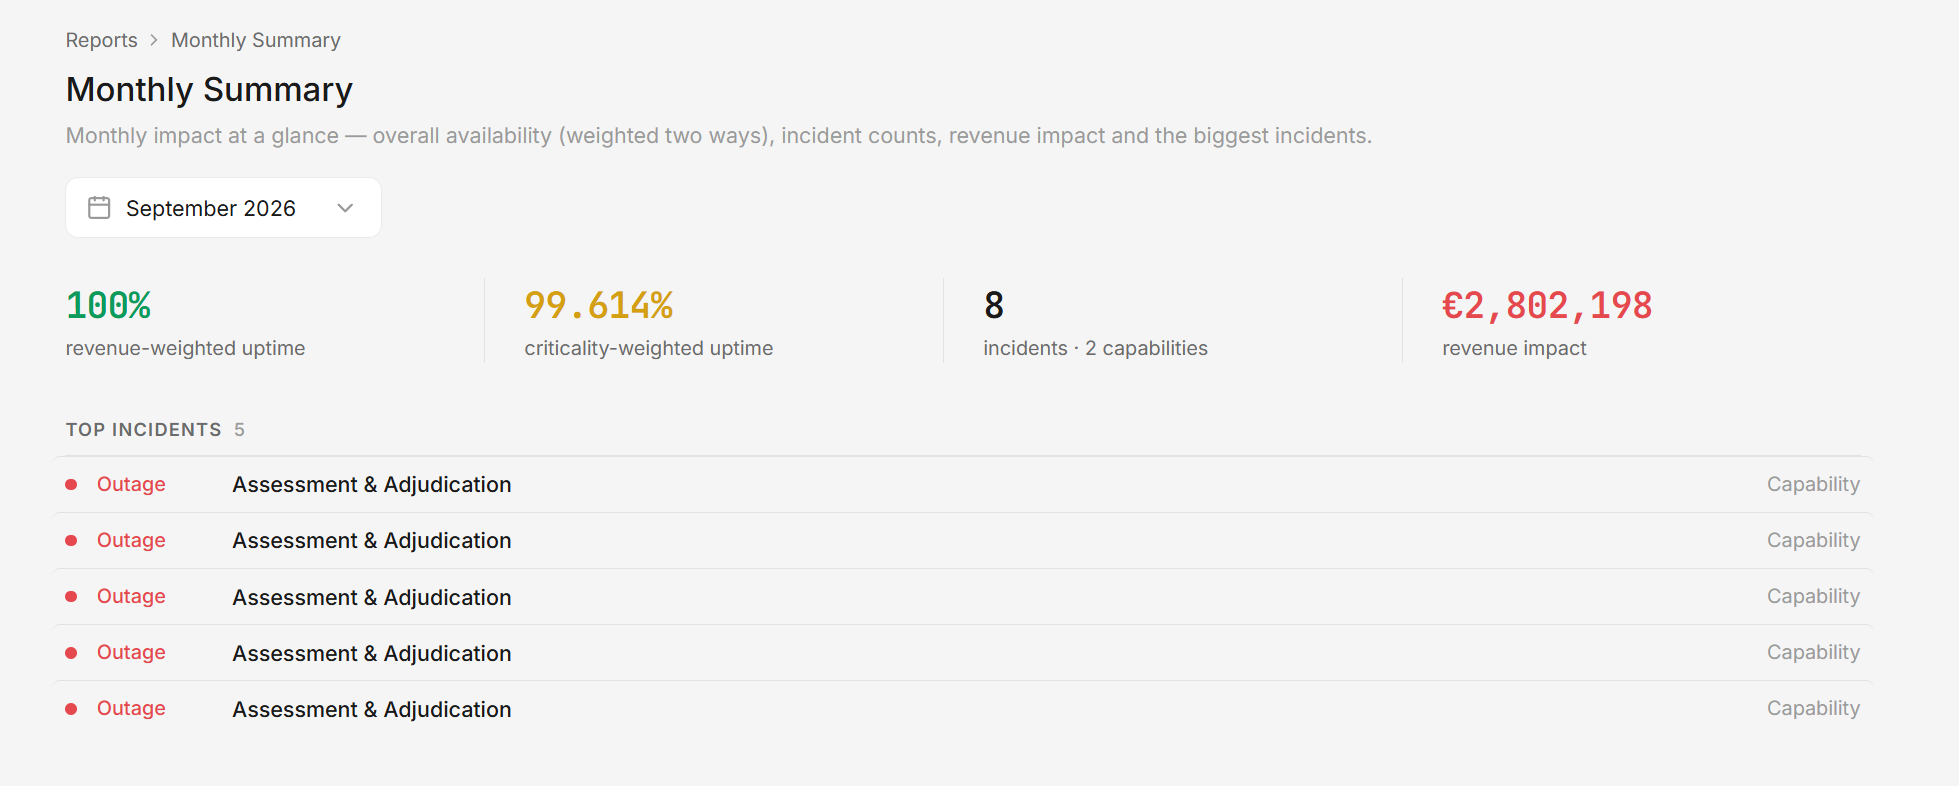
Dependra clusters signal noise into deduplicated incidents, tracks impact live, and freezes SLA-breach penalties per segment the moment they trip — an audit-grade record you can put in front of a customer.
You keep Datadog and ServiceNow. Dependra sits above your detection stack and answers the “so what”.
What Dependra is not.
Every figure on this page is illustrative — the rollup of economics you author. Dependra does the traversal; the business numbers are yours.
See a blast radius on your own landscape.
Point a coding agent at a repo or paste a manifest, then run your first trace.