
“The 2 a.m. bridge call where nobody can say who's affected or what it's costing.”
Know who's affected — and what it costs — in the first five minutes.
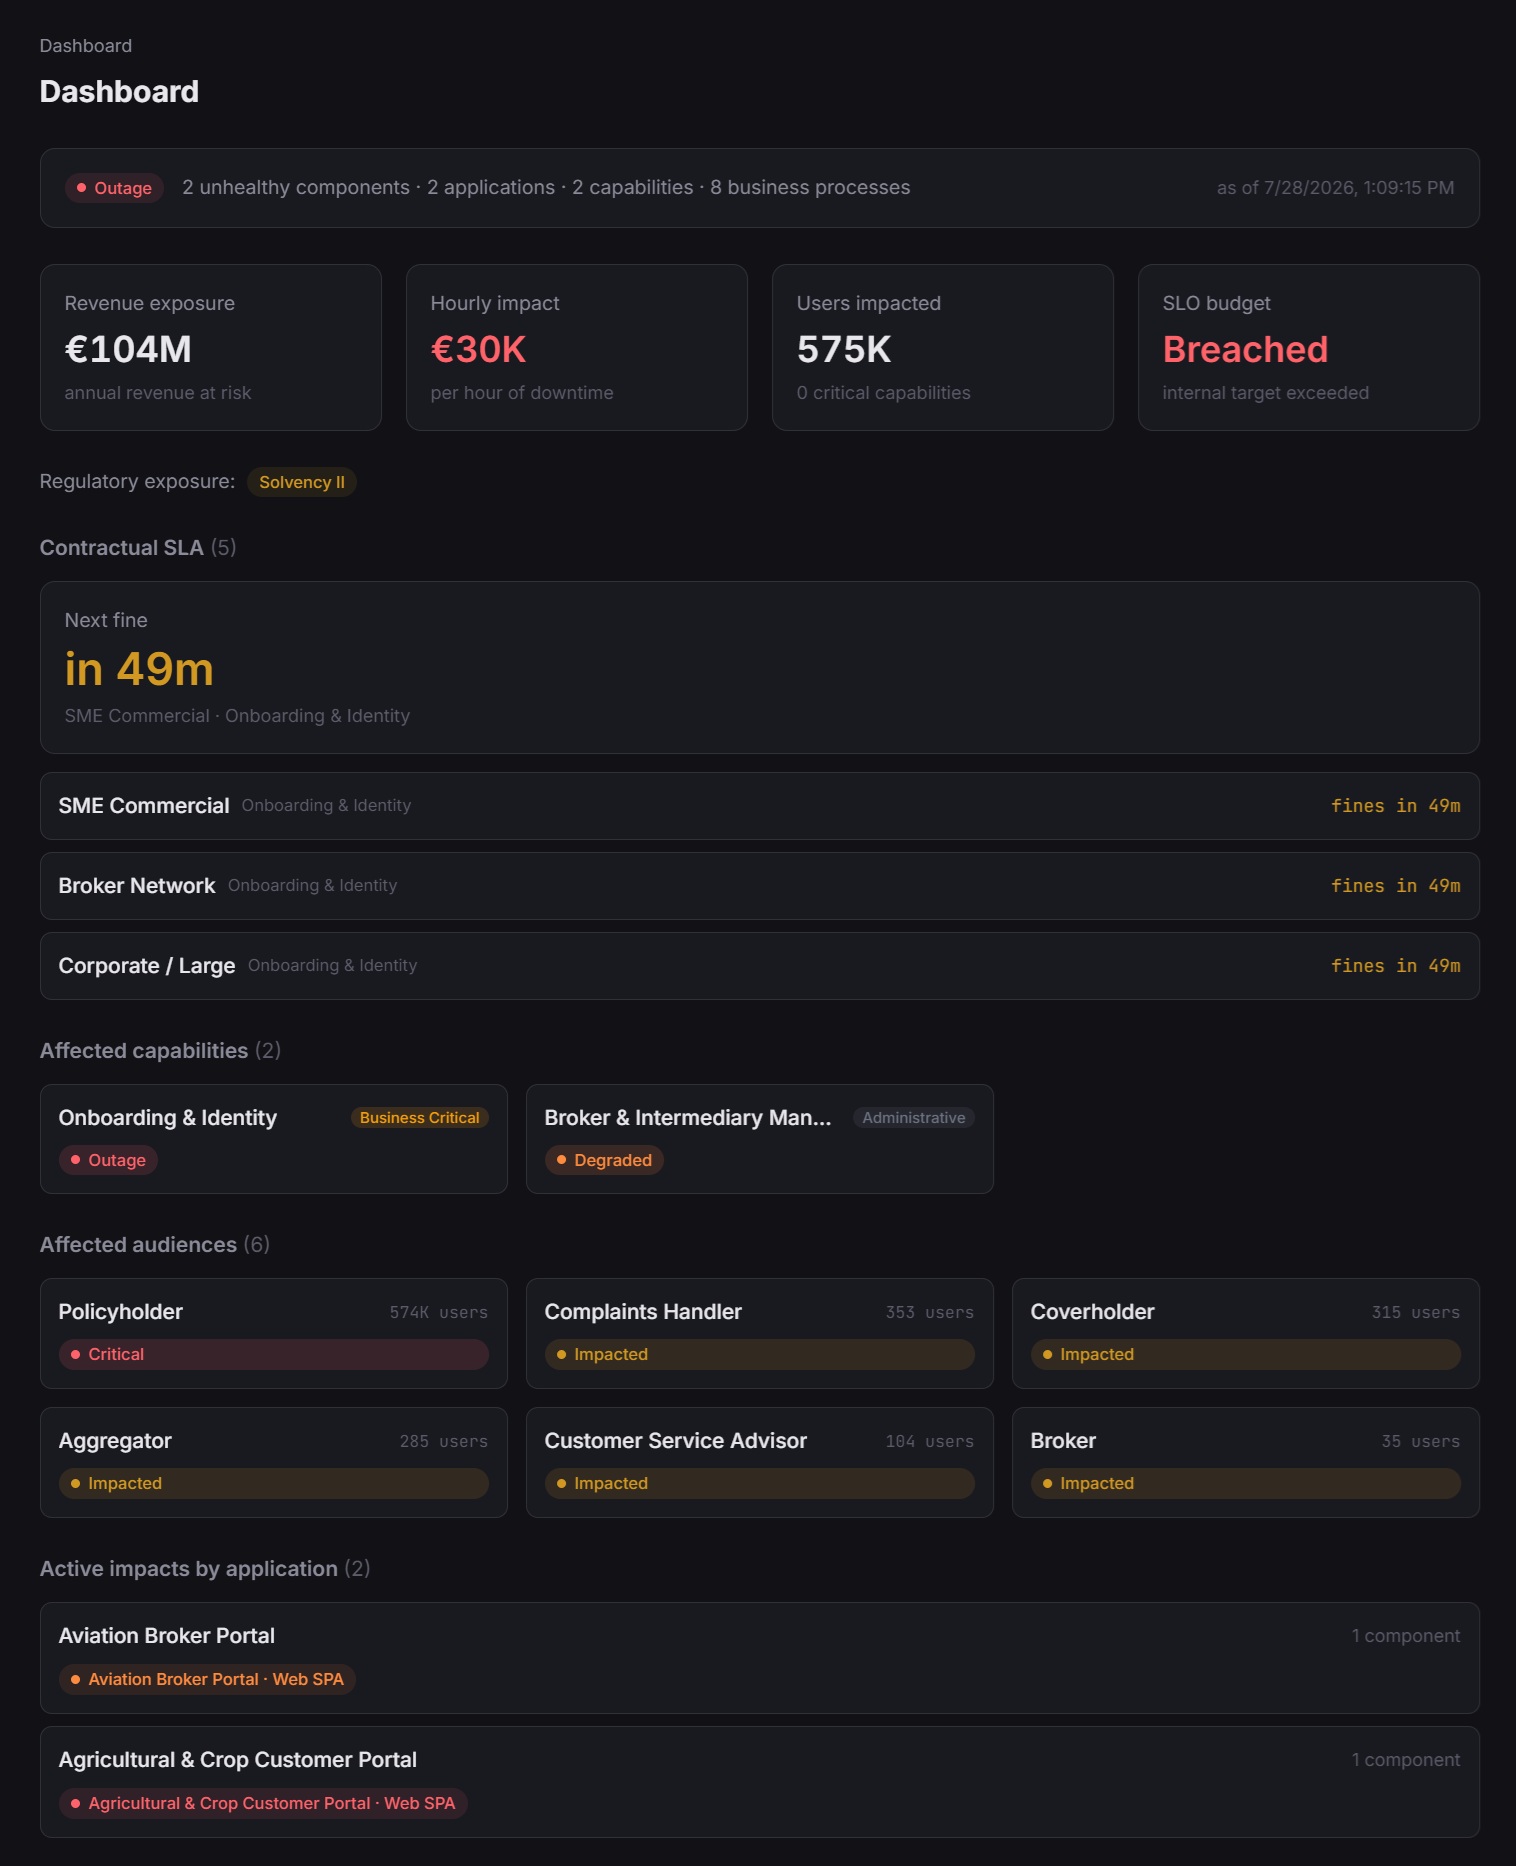
Your monitoring tells you the database is down. Dependra tells you it just put — say, €40k/hour of checkout revenue — at stake, and started the SLA-breach clock on your highest-priority contract. That's the difference between “something's red” and a decision.
Dependra sits above your detection stack
You don't rip out Datadog or ServiceNow. Dependra answers the “so what.” Stream health signals in at scale through a durable queue, and Dependra recomputes the cached impact snapshot, clusters the noise into coherent, deduplicated incidents, and tracks the affected capabilities, audiences and financial impact live.
The blast radius rollup runs continuously off live component health — concentric rings of applications → capabilities → audiences → revenue and SLA. You bring the tools that detect; Dependra brings the answer, and pushes the full impact snapshot into the tools you already page from.
The bridge call, answered
Incidents, deduplicated
The incident lifecycle clusters correlated unhealthy components by connectivity and tracks each incident's effects — a coherent timeline, not a storm of raw signals.
SLA penalties, frozen Enterprise
Per-segment SLA breaches freeze the instant they trip — an audit-grade record to substantiate service credits, not a reconstruction you scramble for later.
Pushed to your stack Enterprise
Outbound webhooks deliver the impact snapshot — cost, SLA and regulatory context — to PagerDuty, Jira, Slack or anything else that accepts a webhook. Idempotent delivery.
Your work, visible upstream Enterprise
The outage you caught at 2 a.m. shows up on the quarterly objective it threatened — your operational win lands in the strategy layer, not just in a post-mortem nobody reads.
Feed the model without touching a wiki
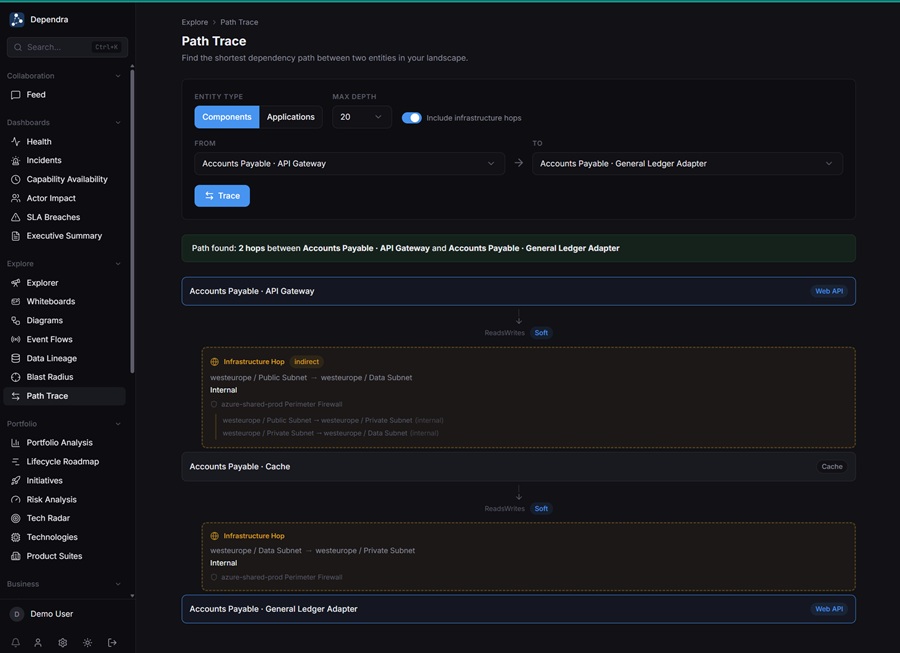
The health-signal pipeline is the same on-ramp that keeps the model current: an API-key endpoint validates and publishes onto a durable queue, returns immediately, and a consumer applies the change, broadcasts real-time events, recomputes impact and runs the incident lifecycle. Wire it in once via the MCP server or a scoped API key.
Turn a red dashboard into a decision
Stream health signals into Dependra and watch current impact resolve into affected capabilities, audiences, revenue and the SLA clock. No payment required to trial.
See live impact